
Workshop 1.3: Basics of Data Analysis with Pandas#
Contributors:
Jose Rodriguez (@Cyb3rPandah)
Ian Hellen (@ianhellen)
Pete Bryan (@Pete Bryan)
Agenda:
Part 1
Importing the Pandas Library
DataFrame, an organized way to represent data
Pandas Structures
Importing data
Interacting with DataFrames
Selecting columns
Indexes
Accessing individual values
pandas I/O functions
Selection and Filtering
Part 2
Sorting and removing duplicates
Grouping
Adding and removing columns
Simple joins
Statistics 101
Notebook: https://aka.ms/Jupyterthon-ws-1-3
License: Creative Commons Attribution-ShareAlike 4.0 International
Q&A - OTR Discord #Jupyterthon #WORKSHOP DAY 1 - BASICS OF DATA ANALYSIS
Importing the Pandas Library#
This entire section of the workshop is based on the Pandas Python Library. Therefore, it makes sense to start by importing the library.
If you have not installed pandas yet, you can install it via pip by running the following code in a notebook cell:
%pip install pandas
import pandas as pd
Representing data in an Organized way: Dataframe#
Pandas Structures#
Series#
A Pandas Series is a one-dimensional array-like object that can hold any data type, with a single Series holding multiple data types if needed. The axis labels area refered to as index.
They can be created from a range of different Python data structures, including a list, ndarry, dictionary or scalar value.
If creating from an list like below we can either specify the index or one can be automatically created.
data = ["Item 1", "Item 2", "Item 3"]
pd.Series(data, index=[1,2,3])
#pd.Series(data, index=["A","B","C"])
1    Item 1
2    Item 2
3    Item 3
dtype: object
When creating from a dictionary an index does not need to be supplied and will be infered from the Dictionary keys:
data = {"A": "Item 1", "B": "Item 2", "C": "Item 3"}
pd.Series(data)
A    Item 1
B    Item 2
C    Item 3
dtype: object
You can also attach names to a Series by using the parameter name. This can help with later understanding.
data = {"A": "Item 1", "B": "Item 2", "C": "Item 3"}
examples_series = pd.Series(data, name="Dictionary Series")
print(examples_series)
print('Name of my Series: ',examples_series.name)
A    Item 1
B    Item 2
C    Item 3
Name: Dictionary Series, dtype: object
Name of my Series:  Dictionary Series
You can find more details about Pandas Series here:
https://pandas.pydata.org/pandas-docs/stable/reference/api/pandas.Series.html
DataFrame#
A Pandas DataFrame is a two-dimensional tabular data structure with labeled axes (rows and columns). Similar to a table.
A DataFrame can be considered to be make up for multiple Series, with each row being its own Series, and as with Series not each column in an DataFrame is necessarily the same type of data.
DataFrames can be created from a range of input types including Pythos data structures such as lists, tuples, dictionaries, Series, ndarrays, or other DataFrames.
As well as the index that a Series has, DataFrames have a second index called ‘columns’, which contains the names assigned to each column in the DataFrame.
data = {"Name": ["Item 1", "Item 2", "Item 3"], "Value": ["6.0", "3.2", "11.9"], "Count": [111, 720, 82]}
pd.DataFrame(data)
| Name | Value | Count | |
|---|---|---|---|
| 0 | Item 1 | 6.0 | 111 |
| 1 | Item 2 | 3.2 | 720 |
| 2 | Item 3 | 11.9 | 82 |
In the example above the columns are infered from the keys of the dictionary and the index is autogenearted. If needed, we can also specify index values by using the index parameter:
import pandas as pd
data = {"Name": ["Item 1", "Item 2", "Item 3"], "Value": ["6.0", "3.2", "11.9"], "Count": [111, 720, 82]}
pd.DataFrame(data, index=["Item 1", "Item 2", "Item 3"])
| Name | Value | Count | |
|---|---|---|---|
| Item 1 | Item 1 | 6.0 | 111 |
| Item 2 | Item 2 | 3.2 | 720 |
| Item 3 | Item 3 | 11.9 | 82 |
You can also create a DataFrame from a group of Series:
data = {"A": "Item 1", "B": "1", "C": "12.3"}
data2 = {"A": "Item 4", "B": "6", "C": "17.1"}
pd.DataFrame([data, data2])
| A | B | C | |
|---|---|---|---|
| 0 | Item 1 | 1 | 12.3 |
| 1 | Item 4 | 6 | 17.1 |
You can also choose to use a column as the index if you wish:
data = {"A": "Item 1", "B": "1", "C": "12.3"}
data2 = {"A": "Item 4", "B": "6", "C": "17.1"}
df = pd.DataFrame([data, data2])
df.set_index("A")
| B | C | |
|---|---|---|
| A | ||
| Item 1 | 1 | 12.3 |
| Item 4 | 6 | 17.1 |
You can find more details about Pandas DataFrames here:
https://pandas.pydata.org/pandas-docs/stable/reference/api/pandas.DataFrame.html
Importing data as a Pandas DataFrame#
In the previous section, we showed how to create a Pandas DataFrame from Python data structures such as Series and Dictionaries.
In addition to this, Pandas contains several READ methods that allow us to convert data stored in different formats such as JSON, EXCEL(CSV, XLSX), SQL, HTML, XML, and PICKLE.
Importing JSON files#
We already showed to you how to import a JSON file using the read_json method.
Additionally to the pandas library we imported at the beginning of the session, we will need to import the JSON module from pandas.io in order to be able to use the read_json method.
from pandas.io import json
Now we should be able to read our JSON file (List of Dictionaries). As you can see in the code below, the read_json method returns a Pandas DataFrame.
json_df = json.read_json(path_or_buf='../data/techniques_to_events_mapping.json')
print(type(json_df))
json_df.head(n=1)
<class 'pandas.core.frame.DataFrame'>
| technique_id | x_mitre_is_subtechnique | technique | tactic | platform | data_source | data_component | name | source | relationship | target | event_id | event_name | event_platform | audit_category | audit_sub_category | log_channel | log_provider | filter_in | |
|---|---|---|---|---|---|---|---|---|---|---|---|---|---|---|---|---|---|---|---|
| 0 | T1547.004 | True | Winlogon Helper DLL | [persistence, privilege-escalation] | [Windows] | windows registry | windows registry key modification | Process modified Windows registry key value | process | modified | windows registry key value | 13 | RegistryEvent (Value Set). | Windows | RegistryEvent | None | Microsoft-Windows-Sysmon/Operational | Microsoft-Windows-Sysmon | NaN |
Each dictionary within the JSON file we read previously is stored in different lines. What if each dictionary is stored in one line of our JSON file? This is the case of pre-recorded datasets from our Security Datasets OTR Project.
In this case we will need to set the parameter lines to True.
json_df2 = json.read_json(path_or_buf='../data/empire_shell_net_localgroup_administrators_2020-09-21191843.json',lines = True)
print(type(json_df2))
json_df2.head(n=1)
<class 'pandas.core.frame.DataFrame'>
| Keywords | SeverityValue | TargetObject | EventTypeOrignal | EventID | ProviderGuid | ExecutionProcessID | host | Channel | UserID | ... | SourceIsIpv6 | DestinationPortName | DestinationHostname | Service | Details | ShareName | EnabledPrivilegeList | DisabledPrivilegeList | ShareLocalPath | RelativeTargetName | |
|---|---|---|---|---|---|---|---|---|---|---|---|---|---|---|---|---|---|---|---|---|---|
| 0 | -9223372036854775808 | 2 | HKU\S-1-5-21-4228717743-1032521047-1810997296-... | INFO | 12 | {5770385F-C22A-43E0-BF4C-06F5698FFBD9} | 3172 | wec.internal.cloudapp.net | Microsoft-Windows-Sysmon/Operational | S-1-5-18 | ... | NaN | NaN | NaN | NaN | NaN | NaN | NaN | NaN | NaN | NaN |
1 rows × 155 columns
If your JSON file contains columns that store dates, you can use the parameter convert_dates to convert strings into values with date format. For example, lets check the type of value for the first record of the column @timestamp.
type(json_df2.iloc[0]['@timestamp'])
str
As you can see in the output of the previous cell, the type of value is str or string. Let’s read the JSON file setting the parameter convert_dates with a list that contains the names of the columns that store dates.
json_df2_dates = json.read_json(path_or_buf='../data/empire_shell_net_localgroup_administrators_2020-09-21191843.json',
                          lines = True,convert_dates=['@timestamp'])
type(json_df2_dates.iloc[0]['@timestamp'])
pandas._libs.tslibs.timestamps.Timestamp
Importing CSV files#
Another useful format in InfoSec is CSV (Comma Separated Values). To import a CSV file we will use the read_csv method.
csv_df = pd.read_csv("../data/process_tree.csv")
print(type(csv_df))
csv_df.head(n=1)
<class 'pandas.core.frame.DataFrame'>
| Unnamed: 0 | TenantId | Account | EventID | TimeGenerated | Computer | SubjectUserSid | SubjectUserName | SubjectDomainName | SubjectLogonId | ... | NewProcessName | TokenElevationType | ProcessId | CommandLine | ParentProcessName | TargetLogonId | SourceComputerId | TimeCreatedUtc | NodeRole | Level | |
|---|---|---|---|---|---|---|---|---|---|---|---|---|---|---|---|---|---|---|---|---|---|
| 0 | 0 | 802d39e1-9d70-404d-832c-2de5e2478eda | MSTICAlertsWin1\MSTICAdmin | 4688 | 2019-01-15 05:15:15.677 | MSTICAlertsWin1 | S-1-5-21-996632719-2361334927-4038480536-500 | MSTICAdmin | MSTICAlertsWin1 | 0xfaac27 | ... | C:\Diagnostics\UserTmp\ftp.exe | %%1936 | 0xbc8 | .\ftp -s:C:\RECYCLER\xxppyy.exe | C:\Windows\System32\cmd.exe | 0x0 | 46fe7078-61bb-4bed-9430-7ac01d91c273 | 2019-01-15 05:15:15.677 | source | 0 |
1 rows × 21 columns
If your CSV file contains columns that store dates, you can use the parameter parse_dates to convert strings into values with date format. For example, lets check the type of value for the first record of the column TimeGenerated.
print(type(csv_df.iloc[0]["TimeGenerated"]))
<class 'str'>
As you can see in the output of the previous cell, the type of value is str or string. Let’s read the CSV file setting the parameter parse_dates with a list that contains the names of the columns that store dates.
csv_df_date = pd.read_csv("../data/process_tree.csv", parse_dates=["TimeGenerated"])
print(type(csv_df_date.iloc[0]["TimeGenerated"]))
<class 'pandas._libs.tslibs.timestamps.Timestamp'>
Notes on CSV Files#
Other useful options for CSV include:
pd.read_csv(
file_path,
index_col=0, # if CSV already has an index col
header=row_num, # which row headers are found in (def = first row)
on_bad_lines="warn", # warn but don't fail on line parsing (other options are "error", "skip"
)
Importing PICKLE files#
Another useful format in InfoSec is PICKLE. This type of files can be used to serialize Python object structures such as dictionaries, tuples, and lists. To import a PICKLE file we will use the read_pickle method.
pkl_df = pd.read_pickle("../data/host_logons.pkl")
print(type(pkl_df))
pkl_df.head(n=1)
<class 'pandas.core.frame.DataFrame'>
| Account | EventID | TimeGenerated | Computer | SubjectUserName | SubjectDomainName | SubjectUserSid | TargetUserName | TargetDomainName | TargetUserSid | TargetLogonId | LogonType | IpAddress | WorkstationName | TimeCreatedUtc | |
|---|---|---|---|---|---|---|---|---|---|---|---|---|---|---|---|
| 0 | NT AUTHORITY\SYSTEM | 4624 | 2019-02-12 04:56:34.307 | MSTICAlertsWin1 | MSTICAlertsWin1$ | WORKGROUP | S-1-5-18 | SYSTEM | NT AUTHORITY | S-1-5-18 | 0x3e7 | 5 | - | - | 2019-02-12 04:56:34.307 |
Importing Remote Files#
Most read_* methods accept a path to the local file system and some of them accept paths to remote files. Let’s check an example with a remote CSV file.
csv_remote = pd.read_csv(filepath_or_buffer='https://raw.githubusercontent.com/OTRF/OSSEM-DM/main/use-cases/mitre_attack/attack_events_mapping.csv')
print(type(csv_remote))
csv_remote.head(n=1)
<class 'pandas.core.frame.DataFrame'>
| Data Source | Component | Source | Relationship | Target | EventID | Event Name | Event Platform | Log Provider | Log Channel | Audit Category | Audit Sub-Category | Enable Commands | GPO Audit Policy | |
|---|---|---|---|---|---|---|---|---|---|---|---|---|---|---|
| 0 | User Account | user account authentication | user | attempted to authenticate from | port | 4624 | An account was successfully logged on. | Windows | Microsoft-Windows-Security-Auditing | Security | Logon/Logoff | Logon | auditpol /set /subcategory:Logon /success:enab... | Computer Configuration -> Windows Settings -> ... |
You can find more details about Pandas’ read_* methods here:
Interacting with DataFrames#
import pandas as pd

# We're going to read another data set in with more variety
logons_full_df = pd.read_pickle("../data/host_logons.pkl")
net_full_df = pd.read_pickle("../data/az_net_comms_df.pkl")

# also create a demo version with just 20 rows
logons_df = logons_full_df[logons_full_df.index.isin(
    [8, 31, 68, 111, 146, 73, 135, 46, 12, 93, 110, 36, 9, 142, 29, 130, 74, 100, 155, 70]
)]
logons_df.head(5)
| Account | EventID | TimeGenerated | Computer | SubjectUserName | SubjectDomainName | SubjectUserSid | TargetUserName | TargetDomainName | TargetUserSid | TargetLogonId | LogonType | IpAddress | WorkstationName | TimeCreatedUtc | |
|---|---|---|---|---|---|---|---|---|---|---|---|---|---|---|---|
| 8 | NT AUTHORITY\SYSTEM | 4624 | 2019-02-12 04:44:10.343 | MSTICAlertsWin1 | MSTICAlertsWin1$ | WORKGROUP | S-1-5-18 | SYSTEM | NT AUTHORITY | S-1-5-18 | 0x3e7 | 5 | - | - | 2019-02-12 04:44:10.343 |
| 9 | NT AUTHORITY\SYSTEM | 4624 | 2019-02-12 04:40:11.867 | MSTICAlertsWin1 | MSTICAlertsWin1$ | WORKGROUP | S-1-5-18 | SYSTEM | NT AUTHORITY | S-1-5-18 | 0x3e7 | 5 | - | - | 2019-02-12 04:40:11.867 |
| 12 | NT AUTHORITY\SYSTEM | 4624 | 2019-02-12 04:40:03.870 | MSTICAlertsWin1 | - | - | S-1-0-0 | SYSTEM | NT AUTHORITY | S-1-5-18 | 0x3e7 | 0 | - | - | 2019-02-12 04:40:03.870 |
| 29 | NT AUTHORITY\SYSTEM | 4624 | 2019-02-12 04:40:11.620 | MSTICAlertsWin1 | MSTICAlertsWin1$ | WORKGROUP | S-1-5-18 | SYSTEM | NT AUTHORITY | S-1-5-18 | 0x3e7 | 5 | - | - | 2019-02-12 04:40:11.620 |
| 31 | MSTICAlertsWin1\MSTICAdmin | 4624 | 2019-02-11 22:47:53.750 | MSTICAlertsWin1 | MSTICAlertsWin1$ | WORKGROUP | S-1-5-18 | MSTICAdmin | MSTICAlertsWin1 | S-1-5-21-996632719-2361334927-4038480536-500 | 0xc54c7b9 | 4 | - | MSTICAlertsWin1 | 2019-02-11 22:47:53.750 |
Size/Shape of a DataFrame#
print("shape = rows x columns")
logons_df.shape
shape = rows x columns
(20, 15)
len(logons_df)
20
Single row of DataFrame == Series#
display(logons_df.iloc[0].head())
print("Type of single row - logons_df.iloc[0])", type(logons_df.iloc[0])) # First row
Account                   NT AUTHORITY\SYSTEM
EventID                                  4624
TimeGenerated      2019-02-12 04:44:10.343000
Computer                      MSTICAlertsWin1
SubjectUserName              MSTICAlertsWin1$
Name: 8, dtype: object
Type of single row - logons_df.iloc[0]) <class 'pandas.core.series.Series'>
Intersection of a row and column is a simple type - the cell content#
print("\nIntersection - logons_df.iloc[0].Account")
print("Type:", type(logons_df.iloc[0].Account))
print("Value:", logons_df.iloc[0].Account)
Intersection - logons_df.iloc[0].Account
Type: <class 'str'>
Value: NT AUTHORITY\SYSTEM
Selecting Columns#
df.column_name
df[column_name]
Selecting a single column
logons_df.Account.head()
8            NT AUTHORITY\SYSTEM
9            NT AUTHORITY\SYSTEM
12           NT AUTHORITY\SYSTEM
29           NT AUTHORITY\SYSTEM
31    MSTICAlertsWin1\MSTICAdmin
Name: Account, dtype: object
More general syntax (and mandatory if column name has spaces or other illegal chars, like “.”, “-”)
logons_df["Account"].head()
8            NT AUTHORITY\SYSTEM
9            NT AUTHORITY\SYSTEM
12           NT AUTHORITY\SYSTEM
29           NT AUTHORITY\SYSTEM
31    MSTICAlertsWin1\MSTICAdmin
Name: Account, dtype: object
To select multiple columns you use a Python list as the column selector
my_cols = ["Account", "TimeGenerated"]
logons_df[my_cols].head()
| Account | TimeGenerated | |
|---|---|---|
| 8 | NT AUTHORITY\SYSTEM | 2019-02-12 04:44:10.343 |
| 9 | NT AUTHORITY\SYSTEM | 2019-02-12 04:40:11.867 |
| 12 | NT AUTHORITY\SYSTEM | 2019-02-12 04:40:03.870 |
| 29 | NT AUTHORITY\SYSTEM | 2019-02-12 04:40:11.620 |
| 31 | MSTICAlertsWin1\MSTICAdmin | 2019-02-11 22:47:53.750 |
Or an inline/literal list
Note the double “[[” “]]” - indicating a [list], within the [] indexer syntax
logons_df[["Account", "TimeGenerated"]].head()
| Account | TimeGenerated | |
|---|---|---|
| 8 | NT AUTHORITY\SYSTEM | 2019-02-12 04:44:10.343 |
| 9 | NT AUTHORITY\SYSTEM | 2019-02-12 04:40:11.867 |
| 12 | NT AUTHORITY\SYSTEM | 2019-02-12 04:40:03.870 |
| 29 | NT AUTHORITY\SYSTEM | 2019-02-12 04:40:11.620 |
| 31 | MSTICAlertsWin1\MSTICAdmin | 2019-02-11 22:47:53.750 |
Use the columns property to get the column names#
logons_df.columns
Index(['Account', 'EventID', 'TimeGenerated', 'Computer', 'SubjectUserName',
       'SubjectDomainName', 'SubjectUserSid', 'TargetUserName',
       'TargetDomainName', 'TargetUserSid', 'TargetLogonId', 'LogonType',
       'IpAddress', 'WorkstationName', 'TimeCreatedUtc'],
      dtype='object')
Indexes - brief introduction#
Pandas default index is a monotonically-increasing integer (a Python range)
logons_df.index
Int64Index([  8,   9,  12,  29,  31,  36,  46,  68,  70,  73,  74,  93, 100,
            110, 111, 130, 135, 142, 146, 155],
           dtype='int64')
df.loc[index_value]
vs.
df.iloc[row#]
# Access a row at an index location
logons_df.loc[8]
Account                     NT AUTHORITY\SYSTEM
EventID                                    4624
TimeGenerated        2019-02-12 04:44:10.343000
Computer                        MSTICAlertsWin1
SubjectUserName                MSTICAlertsWin1$
SubjectDomainName                     WORKGROUP
SubjectUserSid                         S-1-5-18
TargetUserName                           SYSTEM
TargetDomainName                   NT AUTHORITY
TargetUserSid                          S-1-5-18
TargetLogonId                             0x3e7
LogonType                                     5
IpAddress                                     -
WorkstationName                               -
TimeCreatedUtc       2019-02-12 04:44:10.343000
Name: 8, dtype: object
# Access a row at a physical row location
logons_df.iloc[8]
Account                     NT AUTHORITY\SYSTEM
EventID                                    4624
TimeGenerated        2019-02-14 04:20:54.370000
Computer                        MSTICAlertsWin1
SubjectUserName                               -
SubjectDomainName                             -
SubjectUserSid                          S-1-0-0
TargetUserName                           SYSTEM
TargetDomainName                   NT AUTHORITY
TargetUserSid                          S-1-5-18
TargetLogonId                             0x3e7
LogonType                                     0
IpAddress                                     -
WorkstationName                               -
TimeCreatedUtc       2019-02-14 04:20:54.370000
Name: 70, dtype: object
Setting another column as index#
df.set_index(column_name)
indexed_logons_df = logons_df.set_index("Account")

print("Default index")
display(logons_df.head(3))

print("Indexed by Account column")
display(indexed_logons_df.head(3))
Default index
| Account | EventID | TimeGenerated | Computer | SubjectUserName | SubjectDomainName | SubjectUserSid | TargetUserName | TargetDomainName | TargetUserSid | TargetLogonId | LogonType | IpAddress | WorkstationName | TimeCreatedUtc | |
|---|---|---|---|---|---|---|---|---|---|---|---|---|---|---|---|
| 8 | NT AUTHORITY\SYSTEM | 4624 | 2019-02-12 04:44:10.343 | MSTICAlertsWin1 | MSTICAlertsWin1$ | WORKGROUP | S-1-5-18 | SYSTEM | NT AUTHORITY | S-1-5-18 | 0x3e7 | 5 | - | - | 2019-02-12 04:44:10.343 |
| 9 | NT AUTHORITY\SYSTEM | 4624 | 2019-02-12 04:40:11.867 | MSTICAlertsWin1 | MSTICAlertsWin1$ | WORKGROUP | S-1-5-18 | SYSTEM | NT AUTHORITY | S-1-5-18 | 0x3e7 | 5 | - | - | 2019-02-12 04:40:11.867 |
| 12 | NT AUTHORITY\SYSTEM | 4624 | 2019-02-12 04:40:03.870 | MSTICAlertsWin1 | - | - | S-1-0-0 | SYSTEM | NT AUTHORITY | S-1-5-18 | 0x3e7 | 0 | - | - | 2019-02-12 04:40:03.870 |
Indexed by Account column
| EventID | TimeGenerated | Computer | SubjectUserName | SubjectDomainName | SubjectUserSid | TargetUserName | TargetDomainName | TargetUserSid | TargetLogonId | LogonType | IpAddress | WorkstationName | TimeCreatedUtc | |
|---|---|---|---|---|---|---|---|---|---|---|---|---|---|---|
| Account | ||||||||||||||
| NT AUTHORITY\SYSTEM | 4624 | 2019-02-12 04:44:10.343 | MSTICAlertsWin1 | MSTICAlertsWin1$ | WORKGROUP | S-1-5-18 | SYSTEM | NT AUTHORITY | S-1-5-18 | 0x3e7 | 5 | - | - | 2019-02-12 04:44:10.343 |
| NT AUTHORITY\SYSTEM | 4624 | 2019-02-12 04:40:11.867 | MSTICAlertsWin1 | MSTICAlertsWin1$ | WORKGROUP | S-1-5-18 | SYSTEM | NT AUTHORITY | S-1-5-18 | 0x3e7 | 5 | - | - | 2019-02-12 04:40:11.867 |
| NT AUTHORITY\SYSTEM | 4624 | 2019-02-12 04:40:03.870 | MSTICAlertsWin1 | - | - | S-1-0-0 | SYSTEM | NT AUTHORITY | S-1-5-18 | 0x3e7 | 0 | - | - | 2019-02-12 04:40:03.870 |
Locating rows by index value
(note index is NOT unique)
display(indexed_logons_df.loc["MSTICAlertsWin1\\MSTICAdmin"].head(3))
| EventID | TimeGenerated | Computer | SubjectUserName | SubjectDomainName | SubjectUserSid | TargetUserName | TargetDomainName | TargetUserSid | TargetLogonId | LogonType | IpAddress | WorkstationName | TimeCreatedUtc | |
|---|---|---|---|---|---|---|---|---|---|---|---|---|---|---|
| Account | ||||||||||||||
| MSTICAlertsWin1\MSTICAdmin | 4624 | 2019-02-11 22:47:53.750 | MSTICAlertsWin1 | MSTICAlertsWin1$ | WORKGROUP | S-1-5-18 | MSTICAdmin | MSTICAlertsWin1 | S-1-5-21-996632719-2361334927-4038480536-500 | 0xc54c7b9 | 4 | - | MSTICAlertsWin1 | 2019-02-11 22:47:53.750 |
| MSTICAlertsWin1\MSTICAdmin | 4624 | 2019-02-11 09:58:48.773 | MSTICAlertsWin1 | MSTICAlertsWin1$ | WORKGROUP | S-1-5-18 | MSTICAdmin | MSTICAlertsWin1 | S-1-5-21-996632719-2361334927-4038480536-500 | 0xbd57571 | 4 | - | MSTICAlertsWin1 | 2019-02-11 09:58:48.773 |
| MSTICAlertsWin1\MSTICAdmin | 4624 | 2019-02-15 03:56:57.070 | MSTICAlertsWin1 | - | - | S-1-0-0 | MSTICAdmin | MSTICAlertsWin1 | S-1-5-21-996632719-2361334927-4038480536-500 | 0x1096a6d | 3 | 131.107.147.209 | IANHELLE-DEV17 | 2019-02-15 03:56:57.070 |
Physical row indexing works as before - not affected by index
indexed_logons_df.iloc[1]
EventID                                    4624
TimeGenerated        2019-02-12 04:40:11.867000
Computer                        MSTICAlertsWin1
SubjectUserName                MSTICAlertsWin1$
SubjectDomainName                     WORKGROUP
SubjectUserSid                         S-1-5-18
TargetUserName                           SYSTEM
TargetDomainName                   NT AUTHORITY
TargetUserSid                          S-1-5-18
TargetLogonId                             0x3e7
LogonType                                     5
IpAddress                                     -
WorkstationName                               -
TimeCreatedUtc       2019-02-12 04:40:11.867000
Name: NT AUTHORITY\SYSTEM, dtype: object
Accessing individual (“cell”) values#
A single value#
Like many things in pandas there are several ways to do something!
df.iloc[expr].ColumnName
iloc to specify a row number + column selectordf.at[index_expr, ColumnName]
at with an index expression + column namedf.iat[row#, col#]
iat is like iloc but in 2 dimensions
print("iloc + named column", logons_df.iloc[0].Account)
print("at - row idx + named column", logons_df.at[8, "Account"])
print("iat - row idx + column idx", logons_df.iat[8, 1])
iloc + named column NT AUTHORITY\SYSTEM
at - row idx + named column NT AUTHORITY\SYSTEM
iat - row idx + column idx 4624
Retrieving values from a pandas series#
print(logons_df.Account.head().values)

print(list(logons_df.Account.head().values))
['NT AUTHORITY\\SYSTEM' 'NT AUTHORITY\\SYSTEM' 'NT AUTHORITY\\SYSTEM'
 'NT AUTHORITY\\SYSTEM' 'MSTICAlertsWin1\\MSTICAdmin']
['NT AUTHORITY\\SYSTEM', 'NT AUTHORITY\\SYSTEM', 'NT AUTHORITY\\SYSTEM', 'NT AUTHORITY\\SYSTEM', 'MSTICAlertsWin1\\MSTICAdmin']
pandas I/O functions#
We covered import from CSV and JSON.
Some notes:
CSV is universal but a bit nasty and very inefficient.
Pickle is good but has changing different format across different Python version
Other good options are:
Parquet
HDF
Feather
DataFrame input functions#
for func_name in dir(pd):
    if func_name.startswith("read_"):
        doc = getattr(pd, func_name).__doc__.split("\n")
        print(func_name, ":" + " " * (20 - len(func_name)) , doc[1].strip())
read_clipboard :       Read text from clipboard and pass to read_csv.
read_csv :             Read a comma-separated values (csv) file into DataFrame.
read_excel :           Read an Excel file into a pandas DataFrame.
read_feather :         Load a feather-format object from the file path.
read_fwf :             Read a table of fixed-width formatted lines into DataFrame.
read_gbq :             Load data from Google BigQuery.
read_hdf :             Read from the store, close it if we opened it.
read_html :            Read HTML tables into a ``list`` of ``DataFrame`` objects.
read_json :            Convert a JSON string to pandas object.
read_orc :             Load an ORC object from the file path, returning a DataFrame.
read_parquet :         Load a parquet object from the file path, returning a DataFrame.
read_pickle :          Load pickled pandas object (or any object) from file.
read_sas :             Read SAS files stored as either XPORT or SAS7BDAT format files.
read_spss :            Load an SPSS file from the file path, returning a DataFrame.
read_sql :             Read SQL query or database table into a DataFrame.
read_sql_query :       Read SQL query into a DataFrame.
read_sql_table :       Read SQL database table into a DataFrame.
read_stata :           Read Stata file into DataFrame.
read_table :           Read general delimited file into DataFrame.
read_xml :             Read XML document into a ``DataFrame`` object.
DataFrame output functions#
df = pd.DataFrame
for func_name in dir(df):
    if func_name.startswith("to_"):
        doc = getattr(df, func_name).__doc__.split("\n")
        print(func_name, ":" + " " * (20 - len(func_name)) , doc[1].strip())
to_clipboard :         Copy object to the system clipboard.
to_csv :               Write object to a comma-separated values (csv) file.
to_dict :              Convert the DataFrame to a dictionary.
to_excel :             Write object to an Excel sheet.
to_feather :           Write a DataFrame to the binary Feather format.
to_gbq :               Write a DataFrame to a Google BigQuery table.
to_hdf :               Write the contained data to an HDF5 file using HDFStore.
to_html :              Render a DataFrame as an HTML table.
to_json :              Convert the object to a JSON string.
to_latex :             Render object to a LaTeX tabular, longtable, or nested table/tabular.
to_markdown :          Print DataFrame in Markdown-friendly format.
to_numpy :             Convert the DataFrame to a NumPy array.
to_parquet :           Write a DataFrame to the binary parquet format.
to_period :            Convert DataFrame from DatetimeIndex to PeriodIndex.
to_pickle :            Pickle (serialize) object to file.
to_records :           Convert DataFrame to a NumPy record array.
to_sql :               Write records stored in a DataFrame to a SQL database.
to_stata :             Export DataFrame object to Stata dta format.
to_string :            Render a DataFrame to a console-friendly tabular output.
to_timestamp :         Cast to DatetimeIndex of timestamps, at *beginning* of period.
to_xarray :            Return an xarray object from the pandas object.
to_xml :               Render a DataFrame to an XML document.
Export to Excel - typically need openpyxl installed (and Excel or similar)#
But you don’t really need Excel any more when you have pandas!
logons_df.to_excel("../data/excel_sample.xlsx")

!start ../data/excel_sample.xlsx
read_json vs json_normalize#
We saw earlier how pandas can read json formatted as records.
json_text = """
[
    {"Computer":"MSTICAlertsWin1","Account":"MSTICAdmin","NewProcessName":"ftp.exe"},
    {"Computer":"MSTICAlertsWin1","Account":"MSTICAdmin","NewProcessName":"reg.exe"},
    {"Computer":"MSTICAlertsWin1","Account":"MSTICAdmin","NewProcessName":"cmd.exe"},
    {"Computer":"MSTICAlertsWin1","Account":"MSTICAdmin","NewProcessName":"rundll32.exe"},
    {"Computer":"MSTICAlertsWin1","Account":"MSTICAdmin","NewProcessName":"rundll32.exe"}
]
"""
pd.read_json(json_text)
| Computer | Account | NewProcessName | |
|---|---|---|---|
| 0 | MSTICAlertsWin1 | MSTICAdmin | ftp.exe |
| 1 | MSTICAlertsWin1 | MSTICAdmin | reg.exe |
| 2 | MSTICAlertsWin1 | MSTICAdmin | cmd.exe |
| 3 | MSTICAlertsWin1 | MSTICAdmin | rundll32.exe |
| 4 | MSTICAlertsWin1 | MSTICAdmin | rundll32.exe |
For nested structures you need json_normalize
But json_normalize expects a Python dict, not JSON
json_nested_text = """
[
    {
        "Computer":"MSTICAlertsWin1",
        "SubRecord": {"NewProcessName":"ftp.exe", "pid": 1}
    },
    {
        "Computer":"MSTICAlertsWin1",
        "SubRecord": {"NewProcessName":"reg.exe", "pid": 2}
    },
    {
        "Computer":"MSTICAlertsWin1",
        "SubRecord": {"NewProcessName":"cmd.exe", "pid": 3}
    }
]
"""

try:
    pd.json_normalize(json_nested_text)
except Exception as err:
    print("oh-oh - raw JSON!:", err)

import json

pd.json_normalize(json.loads(json_nested_text))
oh-oh - raw JSON!: 'str' object has no attribute 'values'
| Computer | SubRecord.NewProcessName | SubRecord.pid | |
|---|---|---|---|
| 0 | MSTICAlertsWin1 | ftp.exe | 1 |
| 1 | MSTICAlertsWin1 | reg.exe | 2 |
| 2 | MSTICAlertsWin1 | cmd.exe | 3 |
read_html to read tables from web pages#
Tables in the web page are returned as a list of DataFrames
pd.read_html("https://attack.mitre.org/tactics/enterprise/")[0]
| ID | Name | Description | |
|---|---|---|---|
| 0 | TA0043 | Reconnaissance | The adversary is trying to gather information ... |
| 1 | TA0042 | Resource Development | The adversary is trying to establish resources... |
| 2 | TA0001 | Initial Access | The adversary is trying to get into your network. |
| 3 | TA0002 | Execution | The adversary is trying to run malicious code. |
| 4 | TA0003 | Persistence | The adversary is trying to maintain their foot... |
| 5 | TA0004 | Privilege Escalation | The adversary is trying to gain higher-level p... |
| 6 | TA0005 | Defense Evasion | The adversary is trying to avoid being detected. |
| 7 | TA0006 | Credential Access | The adversary is trying to steal account names... |
| 8 | TA0007 | Discovery | The adversary is trying to figure out your env... |
| 9 | TA0008 | Lateral Movement | The adversary is trying to move through your e... |
| 10 | TA0009 | Collection | The adversary is trying to gather data of inte... |
| 11 | TA0011 | Command and Control | The adversary is trying to communicate with co... |
| 12 | TA0010 | Exfiltration | The adversary is trying to steal data. |
| 13 | TA0040 | Impact | The adversary is trying to manipulate, interru... |
Selecting/Searching#
Specific row (or col) by number#
df.iloc[row#]/df.iloc[row-range]
logons_df.iloc[2].Account
'NT AUTHORITY\\SYSTEM'
logons_df.iloc[3:6]
| Account | EventID | TimeGenerated | Computer | SubjectUserName | SubjectDomainName | SubjectUserSid | TargetUserName | TargetDomainName | TargetUserSid | TargetLogonId | LogonType | IpAddress | WorkstationName | TimeCreatedUtc | |
|---|---|---|---|---|---|---|---|---|---|---|---|---|---|---|---|
| 29 | NT AUTHORITY\SYSTEM | 4624 | 2019-02-12 04:40:11.620 | MSTICAlertsWin1 | MSTICAlertsWin1$ | WORKGROUP | S-1-5-18 | SYSTEM | NT AUTHORITY | S-1-5-18 | 0x3e7 | 5 | - | - | 2019-02-12 04:40:11.620 |
| 31 | MSTICAlertsWin1\MSTICAdmin | 4624 | 2019-02-11 22:47:53.750 | MSTICAlertsWin1 | MSTICAlertsWin1$ | WORKGROUP | S-1-5-18 | MSTICAdmin | MSTICAlertsWin1 | S-1-5-21-996632719-2361334927-4038480536-500 | 0xc54c7b9 | 4 | - | MSTICAlertsWin1 | 2019-02-11 22:47:53.750 |
| 36 | MSTICAlertsWin1\MSTICAdmin | 4624 | 2019-02-11 09:58:48.773 | MSTICAlertsWin1 | MSTICAlertsWin1$ | WORKGROUP | S-1-5-18 | MSTICAdmin | MSTICAlertsWin1 | S-1-5-21-996632719-2361334927-4038480536-500 | 0xbd57571 | 4 | - | MSTICAlertsWin1 | 2019-02-11 09:58:48.773 |
You can go full numpy and use iloc with int indexing#
logons_df.iloc[2, 0]
'NT AUTHORITY\\SYSTEM'
Select by content - “Boolean indexing”#
Basic operators#
==
!=
>, <, >=, <=
logons_df["Account"] == "MSTICAlertsWin1\\MSTICAdmin"
8      False
9      False
12     False
29     False
31      True
36      True
46     False
68     False
70     False
73     False
74     False
93     False
100    False
110    False
111    False
130    False
135    False
142    False
146    False
155     True
Name: Account, dtype: bool
Use boolean result of expression to filter DataFrame#
df[bool_expr]
Note#
df[bool_expr] == df.loc[bool_expr]
logons_df.loc[logons_df["Account"] == "MSTICAlertsWin1\\MSTICAdmin"]
| Account | EventID | TimeGenerated | Computer | SubjectUserName | SubjectDomainName | SubjectUserSid | TargetUserName | TargetDomainName | TargetUserSid | TargetLogonId | LogonType | IpAddress | WorkstationName | TimeCreatedUtc | |
|---|---|---|---|---|---|---|---|---|---|---|---|---|---|---|---|
| 31 | MSTICAlertsWin1\MSTICAdmin | 4624 | 2019-02-11 22:47:53.750 | MSTICAlertsWin1 | MSTICAlertsWin1$ | WORKGROUP | S-1-5-18 | MSTICAdmin | MSTICAlertsWin1 | S-1-5-21-996632719-2361334927-4038480536-500 | 0xc54c7b9 | 4 | - | MSTICAlertsWin1 | 2019-02-11 22:47:53.750 |
| 36 | MSTICAlertsWin1\MSTICAdmin | 4624 | 2019-02-11 09:58:48.773 | MSTICAlertsWin1 | MSTICAlertsWin1$ | WORKGROUP | S-1-5-18 | MSTICAdmin | MSTICAlertsWin1 | S-1-5-21-996632719-2361334927-4038480536-500 | 0xbd57571 | 4 | - | MSTICAlertsWin1 | 2019-02-11 09:58:48.773 |
| 155 | MSTICAlertsWin1\MSTICAdmin | 4624 | 2019-02-15 03:56:57.070 | MSTICAlertsWin1 | - | - | S-1-0-0 | MSTICAdmin | MSTICAlertsWin1 | S-1-5-21-996632719-2361334927-4038480536-500 | 0x1096a6d | 3 | 131.107.147.209 | IANHELLE-DEV17 | 2019-02-15 03:56:57.070 |
Other operators with boolean indexing#
Operators vary depending on data type!!!
logons_df.dtypes
Account                      object
EventID                       int64
TimeGenerated        datetime64[ns]
Computer                     object
SubjectUserName              object
SubjectDomainName            object
SubjectUserSid               object
TargetUserName               object
TargetDomainName             object
TargetUserSid                object
TargetLogonId                object
LogonType                     int64
IpAddress                    object
WorkstationName              object
TimeCreatedUtc       datetime64[ns]
dtype: object
Pandas supports string functions - but#
logons_df[logons_df["Account"].endswith("MSTICAdmin")]
---------------------------------------------------------------------------
AttributeError                            Traceback (most recent call last)
~\AppData\Local\Temp/ipykernel_43952/3533411303.py in <module>
----> 1 logons_df[logons_df["Account"].endswith("MSTICAdmin")]

~\AppData\Roaming\Python\Python37\site-packages\pandas\core\generic.py in __getattr__(self, name)
   5460             if self._info_axis._can_hold_identifiers_and_holds_name(name):
   5461                 return self[name]
-> 5462             return object.__getattribute__(self, name)
   5463
   5464     def __setattr__(self, name: str, value) -> None:

AttributeError: 'Series' object has no attribute 'endswith'
What is the logons_df["Account"] in our logons_df["Account"].endswith("MSTICAdmin") expression
logons_df["Account"]
8             NT AUTHORITY\SYSTEM
9             NT AUTHORITY\SYSTEM
12            NT AUTHORITY\SYSTEM
29            NT AUTHORITY\SYSTEM
31     MSTICAlertsWin1\MSTICAdmin
36     MSTICAlertsWin1\MSTICAdmin
46            NT AUTHORITY\SYSTEM
68            NT AUTHORITY\SYSTEM
70            NT AUTHORITY\SYSTEM
73           Window Manager\DWM-1
74           Window Manager\DWM-1
93            NT AUTHORITY\SYSTEM
100          Window Manager\DWM-2
110           NT AUTHORITY\SYSTEM
111           NT AUTHORITY\SYSTEM
130           NT AUTHORITY\SYSTEM
135           NT AUTHORITY\SYSTEM
142           NT AUTHORITY\SYSTEM
146           NT AUTHORITY\SYSTEM
155    MSTICAlertsWin1\MSTICAdmin
Name: Account, dtype: object
We need to tell pandas to apply string operation as a vector function to the series#
df[df[column].str.contains(str_expr)]
logons_df["Account"].str.endswith("MSTICAdmin")
8      False
9      False
12     False
29     False
31      True
36      True
46     False
68     False
70     False
73     False
74     False
93     False
100    False
110    False
111    False
130    False
135    False
142    False
146    False
155     True
Name: Account, dtype: bool
logons_df[logons_df["Account"].str.endswith("MSTICAdmin")]
| Account | EventID | TimeGenerated | Computer | SubjectUserName | SubjectDomainName | SubjectUserSid | TargetUserName | TargetDomainName | TargetUserSid | TargetLogonId | LogonType | IpAddress | WorkstationName | TimeCreatedUtc | |
|---|---|---|---|---|---|---|---|---|---|---|---|---|---|---|---|
| 31 | MSTICAlertsWin1\MSTICAdmin | 4624 | 2019-02-11 22:47:53.750 | MSTICAlertsWin1 | MSTICAlertsWin1$ | WORKGROUP | S-1-5-18 | MSTICAdmin | MSTICAlertsWin1 | S-1-5-21-996632719-2361334927-4038480536-500 | 0xc54c7b9 | 4 | - | MSTICAlertsWin1 | 2019-02-11 22:47:53.750 |
| 36 | MSTICAlertsWin1\MSTICAdmin | 4624 | 2019-02-11 09:58:48.773 | MSTICAlertsWin1 | MSTICAlertsWin1$ | WORKGROUP | S-1-5-18 | MSTICAdmin | MSTICAlertsWin1 | S-1-5-21-996632719-2361334927-4038480536-500 | 0xbd57571 | 4 | - | MSTICAlertsWin1 | 2019-02-11 09:58:48.773 |
| 155 | MSTICAlertsWin1\MSTICAdmin | 4624 | 2019-02-15 03:56:57.070 | MSTICAlertsWin1 | - | - | S-1-0-0 | MSTICAdmin | MSTICAlertsWin1 | S-1-5-21-996632719-2361334927-4038480536-500 | 0x1096a6d | 3 | 131.107.147.209 | IANHELLE-DEV17 | 2019-02-15 03:56:57.070 |
Multiple conditions#
& == AND
| == OR
~ == NOT
Always use parentheses around individual expressions in composite logical expressions!
logons_df[
    (logons_df["Account"].str.endswith("SYSTEM"))
    &
    (logons_df["TimeGenerated"] >= t1)
    &
    (logons_df["TimeGenerated"] <= t2)
]
logons_df[
    logons_df["Account"].str.endswith("MSTICAdmin")
]

# We want to add a time expression
t1 = pd.Timestamp("2019-02-12 04:00")
t2 = pd.to_datetime("2019-02-12 05:00")
t1, t2
(Timestamp('2019-02-12 04:00:00'), Timestamp('2019-02-12 05:00:00'))
logons_df[
    (logons_df["Account"].str.endswith("SYSTEM"))
    &
    (logons_df["TimeGenerated"] >= t1)
    &
    (logons_df["TimeGenerated"] <= t2)
]
| Account | EventID | TimeGenerated | Computer | SubjectUserName | SubjectDomainName | SubjectUserSid | TargetUserName | TargetDomainName | TargetUserSid | TargetLogonId | LogonType | IpAddress | WorkstationName | TimeCreatedUtc | |
|---|---|---|---|---|---|---|---|---|---|---|---|---|---|---|---|
| 8 | NT AUTHORITY\SYSTEM | 4624 | 2019-02-12 04:44:10.343 | MSTICAlertsWin1 | MSTICAlertsWin1$ | WORKGROUP | S-1-5-18 | SYSTEM | NT AUTHORITY | S-1-5-18 | 0x3e7 | 5 | - | - | 2019-02-12 04:44:10.343 |
| 9 | NT AUTHORITY\SYSTEM | 4624 | 2019-02-12 04:40:11.867 | MSTICAlertsWin1 | MSTICAlertsWin1$ | WORKGROUP | S-1-5-18 | SYSTEM | NT AUTHORITY | S-1-5-18 | 0x3e7 | 5 | - | - | 2019-02-12 04:40:11.867 |
| 12 | NT AUTHORITY\SYSTEM | 4624 | 2019-02-12 04:40:03.870 | MSTICAlertsWin1 | - | - | S-1-0-0 | SYSTEM | NT AUTHORITY | S-1-5-18 | 0x3e7 | 0 | - | - | 2019-02-12 04:40:03.870 |
| 29 | NT AUTHORITY\SYSTEM | 4624 | 2019-02-12 04:40:11.620 | MSTICAlertsWin1 | MSTICAlertsWin1$ | WORKGROUP | S-1-5-18 | SYSTEM | NT AUTHORITY | S-1-5-18 | 0x3e7 | 5 | - | - | 2019-02-12 04:40:11.620 |
Without parentheses - &, |, ~ have higher precedence#
### Without parentheses - `&, |, ~` have higher precedence
logons_df[
    logons_df["Account"].str.contains("MSTICAdmin")
    &
    logons_df["TimeGenerated"] >= t1
    &
    logons_df["TimeGenerated"] <= t2
]
---------------------------------------------------------------------------
TypeError                                 Traceback (most recent call last)
~\AppData\Local\Temp/ipykernel_43952/3190794489.py in <module>
      3     logons_df["Account"].str.contains("MSTICAdmin")
      4     &
----> 5     logons_df["TimeGenerated"] >= t1
      6     &
      7     logons_df["TimeGenerated"] <= t2

~\AppData\Roaming\Python\Python37\site-packages\pandas\core\ops\common.py in new_method(self, other)
     63         other = item_from_zerodim(other)
     64
---> 65         return method(self, other)
     66
     67     return new_method

~\AppData\Roaming\Python\Python37\site-packages\pandas\core\arraylike.py in __and__(self, other)
     57     @unpack_zerodim_and_defer("__and__")
     58     def __and__(self, other):
---> 59         return self._logical_method(other, operator.and_)
     60
     61     @unpack_zerodim_and_defer("__rand__")

~\AppData\Roaming\Python\Python37\site-packages\pandas\core\series.py in _logical_method(self, other, op)
   4957         rvalues = extract_array(other, extract_numpy=True)
   4958
-> 4959         res_values = ops.logical_op(lvalues, rvalues, op)
   4960         return self._construct_result(res_values, name=res_name)
   4961

~\AppData\Roaming\Python\Python37\site-packages\pandas\core\ops\array_ops.py in logical_op(left, right, op)
    338     if should_extension_dispatch(lvalues, rvalues):
    339         # Call the method on lvalues
--> 340         res_values = op(lvalues, rvalues)
    341
    342     else:

TypeError: unsupported operand type(s) for &: 'numpy.ndarray' and 'DatetimeArray'
logons_df[
    (logons_df["LogonType"].isin([0, 3, 5]))
    &
    (logons_df["TimeGenerated"].dt.hour >= 4)
    &
    (logons_df["TimeGenerated"].dt.day == 12)
]
| Account | EventID | TimeGenerated | Computer | SubjectUserName | SubjectDomainName | SubjectUserSid | TargetUserName | TargetDomainName | TargetUserSid | TargetLogonId | LogonType | IpAddress | WorkstationName | TimeCreatedUtc | |
|---|---|---|---|---|---|---|---|---|---|---|---|---|---|---|---|
| 8 | NT AUTHORITY\SYSTEM | 4624 | 2019-02-12 04:44:10.343 | MSTICAlertsWin1 | MSTICAlertsWin1$ | WORKGROUP | S-1-5-18 | SYSTEM | NT AUTHORITY | S-1-5-18 | 0x3e7 | 5 | - | - | 2019-02-12 04:44:10.343 |
| 9 | NT AUTHORITY\SYSTEM | 4624 | 2019-02-12 04:40:11.867 | MSTICAlertsWin1 | MSTICAlertsWin1$ | WORKGROUP | S-1-5-18 | SYSTEM | NT AUTHORITY | S-1-5-18 | 0x3e7 | 5 | - | - | 2019-02-12 04:40:11.867 |
| 12 | NT AUTHORITY\SYSTEM | 4624 | 2019-02-12 04:40:03.870 | MSTICAlertsWin1 | - | - | S-1-0-0 | SYSTEM | NT AUTHORITY | S-1-5-18 | 0x3e7 | 0 | - | - | 2019-02-12 04:40:03.870 |
| 29 | NT AUTHORITY\SYSTEM | 4624 | 2019-02-12 04:40:11.620 | MSTICAlertsWin1 | MSTICAlertsWin1$ | WORKGROUP | S-1-5-18 | SYSTEM | NT AUTHORITY | S-1-5-18 | 0x3e7 | 5 | - | - | 2019-02-12 04:40:11.620 |
| 110 | NT AUTHORITY\SYSTEM | 4624 | 2019-02-12 21:20:35.003 | MSTICAlertsWin1 | MSTICAlertsWin1$ | WORKGROUP | S-1-5-18 | SYSTEM | NT AUTHORITY | S-1-5-18 | 0x3e7 | 5 | - | - | 2019-02-12 21:20:35.003 |
| 111 | NT AUTHORITY\SYSTEM | 4624 | 2019-02-12 21:05:29.523 | MSTICAlertsWin1 | MSTICAlertsWin1$ | WORKGROUP | S-1-5-18 | SYSTEM | NT AUTHORITY | S-1-5-18 | 0x3e7 | 5 | - | - | 2019-02-12 21:05:29.523 |
| 130 | NT AUTHORITY\SYSTEM | 4624 | 2019-02-12 20:09:16.550 | MSTICAlertsWin1 | MSTICAlertsWin1$ | WORKGROUP | S-1-5-18 | SYSTEM | NT AUTHORITY | S-1-5-18 | 0x3e7 | 5 | - | - | 2019-02-12 20:09:16.550 |
| 135 | NT AUTHORITY\SYSTEM | 4624 | 2019-02-12 20:30:34.990 | MSTICAlertsWin1 | MSTICAlertsWin1$ | WORKGROUP | S-1-5-18 | SYSTEM | NT AUTHORITY | S-1-5-18 | 0x3e7 | 5 | - | - | 2019-02-12 20:30:34.990 |
| 142 | NT AUTHORITY\SYSTEM | 4624 | 2019-02-12 20:19:52.520 | MSTICAlertsWin1 | MSTICAlertsWin1$ | WORKGROUP | S-1-5-18 | SYSTEM | NT AUTHORITY | S-1-5-18 | 0x3e7 | 5 | - | - | 2019-02-12 20:19:52.520 |
Boolean indexes are Pandas series - you can save and re-use#
# create individual criteria
logon_type_3 = logons_df["LogonType"].isin([0, 3, 5])
hour_4 = logons_df["TimeGenerated"].dt.hour >= 4
day_12 = logons_df["TimeGenerated"].dt.day == 12
# use them together to filter
logons_df[logon_type_3 & hour_4 & day_12]
| Account | EventID | TimeGenerated | Computer | SubjectUserName | SubjectDomainName | SubjectUserSid | TargetUserName | TargetDomainName | TargetUserSid | TargetLogonId | LogonType | IpAddress | WorkstationName | TimeCreatedUtc | |
|---|---|---|---|---|---|---|---|---|---|---|---|---|---|---|---|
| 8 | NT AUTHORITY\SYSTEM | 4624 | 2019-02-12 04:44:10.343 | MSTICAlertsWin1 | MSTICAlertsWin1$ | WORKGROUP | S-1-5-18 | SYSTEM | NT AUTHORITY | S-1-5-18 | 0x3e7 | 5 | - | - | 2019-02-12 04:44:10.343 |
| 9 | NT AUTHORITY\SYSTEM | 4624 | 2019-02-12 04:40:11.867 | MSTICAlertsWin1 | MSTICAlertsWin1$ | WORKGROUP | S-1-5-18 | SYSTEM | NT AUTHORITY | S-1-5-18 | 0x3e7 | 5 | - | - | 2019-02-12 04:40:11.867 |
| 12 | NT AUTHORITY\SYSTEM | 4624 | 2019-02-12 04:40:03.870 | MSTICAlertsWin1 | - | - | S-1-0-0 | SYSTEM | NT AUTHORITY | S-1-5-18 | 0x3e7 | 0 | - | - | 2019-02-12 04:40:03.870 |
| 29 | NT AUTHORITY\SYSTEM | 4624 | 2019-02-12 04:40:11.620 | MSTICAlertsWin1 | MSTICAlertsWin1$ | WORKGROUP | S-1-5-18 | SYSTEM | NT AUTHORITY | S-1-5-18 | 0x3e7 | 5 | - | - | 2019-02-12 04:40:11.620 |
| 110 | NT AUTHORITY\SYSTEM | 4624 | 2019-02-12 21:20:35.003 | MSTICAlertsWin1 | MSTICAlertsWin1$ | WORKGROUP | S-1-5-18 | SYSTEM | NT AUTHORITY | S-1-5-18 | 0x3e7 | 5 | - | - | 2019-02-12 21:20:35.003 |
| 111 | NT AUTHORITY\SYSTEM | 4624 | 2019-02-12 21:05:29.523 | MSTICAlertsWin1 | MSTICAlertsWin1$ | WORKGROUP | S-1-5-18 | SYSTEM | NT AUTHORITY | S-1-5-18 | 0x3e7 | 5 | - | - | 2019-02-12 21:05:29.523 |
| 130 | NT AUTHORITY\SYSTEM | 4624 | 2019-02-12 20:09:16.550 | MSTICAlertsWin1 | MSTICAlertsWin1$ | WORKGROUP | S-1-5-18 | SYSTEM | NT AUTHORITY | S-1-5-18 | 0x3e7 | 5 | - | - | 2019-02-12 20:09:16.550 |
| 135 | NT AUTHORITY\SYSTEM | 4624 | 2019-02-12 20:30:34.990 | MSTICAlertsWin1 | MSTICAlertsWin1$ | WORKGROUP | S-1-5-18 | SYSTEM | NT AUTHORITY | S-1-5-18 | 0x3e7 | 5 | - | - | 2019-02-12 20:30:34.990 |
| 142 | NT AUTHORITY\SYSTEM | 4624 | 2019-02-12 20:19:52.520 | MSTICAlertsWin1 | MSTICAlertsWin1$ | WORKGROUP | S-1-5-18 | SYSTEM | NT AUTHORITY | S-1-5-18 | 0x3e7 | 5 | - | - | 2019-02-12 20:19:52.520 |
isin operator/function#
logons_df[logons_df["TargetUserName"].isin(["MSTICAdmin", "SYSTEM"])].head()
| Account | EventID | TimeGenerated | Computer | SubjectUserName | SubjectDomainName | SubjectUserSid | TargetUserName | TargetDomainName | TargetUserSid | TargetLogonId | LogonType | IpAddress | WorkstationName | TimeCreatedUtc | |
|---|---|---|---|---|---|---|---|---|---|---|---|---|---|---|---|
| 8 | NT AUTHORITY\SYSTEM | 4624 | 2019-02-12 04:44:10.343 | MSTICAlertsWin1 | MSTICAlertsWin1$ | WORKGROUP | S-1-5-18 | SYSTEM | NT AUTHORITY | S-1-5-18 | 0x3e7 | 5 | - | - | 2019-02-12 04:44:10.343 |
| 9 | NT AUTHORITY\SYSTEM | 4624 | 2019-02-12 04:40:11.867 | MSTICAlertsWin1 | MSTICAlertsWin1$ | WORKGROUP | S-1-5-18 | SYSTEM | NT AUTHORITY | S-1-5-18 | 0x3e7 | 5 | - | - | 2019-02-12 04:40:11.867 |
| 12 | NT AUTHORITY\SYSTEM | 4624 | 2019-02-12 04:40:03.870 | MSTICAlertsWin1 | - | - | S-1-0-0 | SYSTEM | NT AUTHORITY | S-1-5-18 | 0x3e7 | 0 | - | - | 2019-02-12 04:40:03.870 |
| 29 | NT AUTHORITY\SYSTEM | 4624 | 2019-02-12 04:40:11.620 | MSTICAlertsWin1 | MSTICAlertsWin1$ | WORKGROUP | S-1-5-18 | SYSTEM | NT AUTHORITY | S-1-5-18 | 0x3e7 | 5 | - | - | 2019-02-12 04:40:11.620 |
| 31 | MSTICAlertsWin1\MSTICAdmin | 4624 | 2019-02-11 22:47:53.750 | MSTICAlertsWin1 | MSTICAlertsWin1$ | WORKGROUP | S-1-5-18 | MSTICAdmin | MSTICAlertsWin1 | S-1-5-21-996632719-2361334927-4038480536-500 | 0xc54c7b9 | 4 | - | MSTICAlertsWin1 | 2019-02-11 22:47:53.750 |
pandas query function#
df.query(query_str)
Useful for simpler queries - and definitely nicer-looking but some limitations - only simple operators supported.Good for quick things but I prefer the boolean stuff for more complex queries.
To reference Python variables prefix the variable name with “@” (see second example)
logons_df.query("TargetUserName == 'MSTICAdmin' and TargetLogonId == '0xc913737'")

logons_df.query("TargetUserName == 'MSTICAdmin' and TimeGenerated > @t1")
| Account | EventID | TimeGenerated | Computer | SubjectUserName | SubjectDomainName | SubjectUserSid | TargetUserName | TargetDomainName | TargetUserSid | TargetLogonId | LogonType | IpAddress | WorkstationName | TimeCreatedUtc | |
|---|---|---|---|---|---|---|---|---|---|---|---|---|---|---|---|
| 155 | MSTICAlertsWin1\MSTICAdmin | 4624 | 2019-02-15 03:56:57.070 | MSTICAlertsWin1 | - | - | S-1-0-0 | MSTICAdmin | MSTICAlertsWin1 | S-1-5-21-996632719-2361334927-4038480536-500 | 0x1096a6d | 3 | 131.107.147.209 | IANHELLE-DEV17 | 2019-02-15 03:56:57.070 |
The output of query is a DataFrame so you can also easily combine with boolean indexing
or part of a longer pandas expression.
(
    logons_df[logons_df["Account"].str.match("MST.*")]
    .query("TimeGenerated > @t1")
)
| Account | EventID | TimeGenerated | Computer | SubjectUserName | SubjectDomainName | SubjectUserSid | TargetUserName | TargetDomainName | TargetUserSid | TargetLogonId | LogonType | IpAddress | WorkstationName | TimeCreatedUtc | |
|---|---|---|---|---|---|---|---|---|---|---|---|---|---|---|---|
| 155 | MSTICAlertsWin1\MSTICAdmin | 4624 | 2019-02-15 03:56:57.070 | MSTICAlertsWin1 | - | - | S-1-0-0 | MSTICAdmin | MSTICAlertsWin1 | S-1-5-21-996632719-2361334927-4038480536-500 | 0x1096a6d | 3 | 131.107.147.209 | IANHELLE-DEV17 | 2019-02-15 03:56:57.070 |
Combing Column Select and filter#
(
    logons_df[logons_df["Account"].str.contains("MSTICAdmin")]
    [["Account", "TimeGenerated"]]
)
| Account | TimeGenerated | |
|---|---|---|
| 31 | MSTICAlertsWin1\MSTICAdmin | 2019-02-11 22:47:53.750 |
| 36 | MSTICAlertsWin1\MSTICAdmin | 2019-02-11 09:58:48.773 |
| 155 | MSTICAlertsWin1\MSTICAdmin | 2019-02-15 03:56:57.070 |
Sorting and removing duplicates#
df.sort_values(column|[column_list]], [ascending=True|False])
logons_df.sort_values("TimeGenerated", ascending=False).head(3)
| Account | EventID | TimeGenerated | Computer | SubjectUserName | SubjectDomainName | SubjectUserSid | TargetUserName | TargetDomainName | TargetUserSid | TargetLogonId | LogonType | IpAddress | WorkstationName | TimeCreatedUtc | |
|---|---|---|---|---|---|---|---|---|---|---|---|---|---|---|---|
| 146 | NT AUTHORITY\SYSTEM | 4624 | 2019-02-15 06:51:51.500 | MSTICAlertsWin1 | MSTICAlertsWin1$ | WORKGROUP | S-1-5-18 | SYSTEM | NT AUTHORITY | S-1-5-18 | 0x3e7 | 5 | - | - | 2019-02-15 06:51:51.500 |
| 155 | MSTICAlertsWin1\MSTICAdmin | 4624 | 2019-02-15 03:56:57.070 | MSTICAlertsWin1 | - | - | S-1-0-0 | MSTICAdmin | MSTICAlertsWin1 | S-1-5-21-996632719-2361334927-4038480536-500 | 0x1096a6d | 3 | 131.107.147.209 | IANHELLE-DEV17 | 2019-02-15 03:56:57.070 |
| 68 | NT AUTHORITY\SYSTEM | 4624 | 2019-02-14 04:21:37.637 | MSTICAlertsWin1 | MSTICAlertsWin1$ | WORKGROUP | S-1-5-18 | SYSTEM | NT AUTHORITY | S-1-5-18 | 0x3e7 | 5 | - | - | 2019-02-14 04:21:37.637 |
df.drop_duplicates()
(
    logons_df[["Account", "LogonType"]]
    .drop_duplicates()
    .sort_values("Account")
)
| Account | LogonType | |
|---|---|---|
| 31 | MSTICAlertsWin1\MSTICAdmin | 4 |
| 155 | MSTICAlertsWin1\MSTICAdmin | 3 |
| 8 | NT AUTHORITY\SYSTEM | 5 |
| 12 | NT AUTHORITY\SYSTEM | 0 |
| 73 | Window Manager\DWM-1 | 2 |
| 100 | Window Manager\DWM-2 | 2 |
Grouping and Aggregation#
df.groupby(column|[column_list]])
logons_df.groupby("Account")
<pandas.core.groupby.generic.DataFrameGroupBy object at 0x000001D81E76DAC8>
You need an aggregator (or iterator) make use of grouping#
Add an aggregation function: sum, count, mean, stdev, etc.
logons_df.groupby("Account").count() # Yuk!
| EventID | TimeGenerated | Computer | SubjectUserName | SubjectDomainName | SubjectUserSid | TargetUserName | TargetDomainName | TargetUserSid | TargetLogonId | LogonType | IpAddress | WorkstationName | TimeCreatedUtc | |
|---|---|---|---|---|---|---|---|---|---|---|---|---|---|---|
| Account | ||||||||||||||
| MSTICAlertsWin1\MSTICAdmin | 3 | 3 | 3 | 3 | 3 | 3 | 3 | 3 | 3 | 3 | 3 | 3 | 3 | 3 |
| NT AUTHORITY\SYSTEM | 14 | 14 | 14 | 14 | 14 | 14 | 14 | 14 | 14 | 14 | 14 | 14 | 14 | 14 |
| Window Manager\DWM-1 | 2 | 2 | 2 | 2 | 2 | 2 | 2 | 2 | 2 | 2 | 2 | 2 | 2 | 2 |
| Window Manager\DWM-2 | 1 | 1 | 1 | 1 | 1 | 1 | 1 | 1 | 1 | 1 | 1 | 1 | 1 | 1 |
Tidy up by limiting and renaming columns
(
    logons_df[["TimeGenerated", "Account"]]
    .groupby("Account")
    .count()
    .rename(columns={"TimeGenerated": "LogonCount"})
)
| LogonCount | |
|---|---|
| Account | |
| MSTICAlertsWin1\MSTICAdmin | 3 |
| NT AUTHORITY\SYSTEM | 14 |
| Window Manager\DWM-1 | 2 |
| Window Manager\DWM-2 | 1 |
Iterating over groups - groupby returns an iterable#
print("Numbers of rows in each group:")

for name, logon_group in logons_df.groupby("Account"):
    print(name, type(logon_group), "size", logon_group.shape)
Numbers of rows in each group:
MSTICAlertsWin1\MSTICAdmin <class 'pandas.core.frame.DataFrame'> size (3, 15)
NT AUTHORITY\SYSTEM <class 'pandas.core.frame.DataFrame'> size (14, 15)
Window Manager\DWM-1 <class 'pandas.core.frame.DataFrame'> size (2, 15)
Window Manager\DWM-2 <class 'pandas.core.frame.DataFrame'> size (1, 15)
print("\nCollect individual group DFs in dictionary")
df_dict = {name: df for name, df in logons_df.groupby("Account")}

print(df_dict.keys())
df_dict["NT AUTHORITY\SYSTEM"].head()
Collect individual group DFs in dictionary
dict_keys(['MSTICAlertsWin1\\MSTICAdmin', 'NT AUTHORITY\\SYSTEM', 'Window Manager\\DWM-1', 'Window Manager\\DWM-2'])
| Account | EventID | TimeGenerated | Computer | SubjectUserName | SubjectDomainName | SubjectUserSid | TargetUserName | TargetDomainName | TargetUserSid | TargetLogonId | LogonType | IpAddress | WorkstationName | TimeCreatedUtc | |
|---|---|---|---|---|---|---|---|---|---|---|---|---|---|---|---|
| 8 | NT AUTHORITY\SYSTEM | 4624 | 2019-02-12 04:44:10.343 | MSTICAlertsWin1 | MSTICAlertsWin1$ | WORKGROUP | S-1-5-18 | SYSTEM | NT AUTHORITY | S-1-5-18 | 0x3e7 | 5 | - | - | 2019-02-12 04:44:10.343 |
| 9 | NT AUTHORITY\SYSTEM | 4624 | 2019-02-12 04:40:11.867 | MSTICAlertsWin1 | MSTICAlertsWin1$ | WORKGROUP | S-1-5-18 | SYSTEM | NT AUTHORITY | S-1-5-18 | 0x3e7 | 5 | - | - | 2019-02-12 04:40:11.867 |
| 12 | NT AUTHORITY\SYSTEM | 4624 | 2019-02-12 04:40:03.870 | MSTICAlertsWin1 | - | - | S-1-0-0 | SYSTEM | NT AUTHORITY | S-1-5-18 | 0x3e7 | 0 | - | - | 2019-02-12 04:40:03.870 |
| 29 | NT AUTHORITY\SYSTEM | 4624 | 2019-02-12 04:40:11.620 | MSTICAlertsWin1 | MSTICAlertsWin1$ | WORKGROUP | S-1-5-18 | SYSTEM | NT AUTHORITY | S-1-5-18 | 0x3e7 | 5 | - | - | 2019-02-12 04:40:11.620 |
| 46 | NT AUTHORITY\SYSTEM | 4624 | 2019-02-10 05:10:54.300 | MSTICAlertsWin1 | MSTICAlertsWin1$ | WORKGROUP | S-1-5-18 | SYSTEM | NT AUTHORITY | S-1-5-18 | 0x3e7 | 5 | - | - | 2019-02-10 05:10:54.300 |
Grouping with Multiple aggregation functions#
.agg({"Column_1": "agg_func", "Column_2": "agg_func"})
import numpy as np

(
    logons_df[["TimeGenerated", "LogonType", "Account"]]
    .groupby("Account")
    .agg({"TimeGenerated": "max", "LogonType": "nunique"})
    .rename(columns={"TimeGenerated": "LastTime"})
)
| LastTime | LogonType | |
|---|---|---|
| Account | ||
| MSTICAlertsWin1\MSTICAdmin | 2019-02-15 03:56:57.070 | 2 |
| NT AUTHORITY\SYSTEM | 2019-02-15 06:51:51.500 | 2 |
| Window Manager\DWM-1 | 2019-02-14 04:20:54.773 | 1 |
| Window Manager\DWM-2 | 2019-02-12 22:22:21.240 | 1 |
Grouping with multiple columns#
.groupby(["Account", "LogonType"])
(
    logons_full_df[["TimeGenerated", "EventID", "Account", "LogonType"]]      # DF input fields
    .groupby(["Account", "LogonType"])                                        # Grouping fields
    .agg({"TimeGenerated": "max", "EventID": "count"})                        # aggregate operations
    .rename(columns={"TimeGenerated": "LastTime", "EventID": "Count"})        # Rename output
)
| LastTime | Count | ||
|---|---|---|---|
| Account | LogonType | ||
| MSTICAlertsWin1\MSTICAdmin | 3 | 2019-02-15 03:57:00.207 | 8 |
| 4 | 2019-02-14 11:51:37.603 | 8 | |
| 10 | 2019-02-15 03:57:02.593 | 2 | |
| MSTICAlertsWin1\ian | 2 | 2019-02-12 20:29:51.030 | 2 |
| 3 | 2019-02-15 03:56:34.440 | 5 | |
| 4 | 2019-02-12 20:41:17.310 | 1 | |
| NT AUTHORITY\IUSR | 5 | 2019-02-14 04:20:56.110 | 2 |
| NT AUTHORITY\LOCAL SERVICE | 5 | 2019-02-14 04:20:54.803 | 2 |
| NT AUTHORITY\NETWORK SERVICE | 5 | 2019-02-14 04:20:54.630 | 2 |
| NT AUTHORITY\SYSTEM | 0 | 2019-02-14 04:20:54.370 | 2 |
| 5 | 2019-02-15 11:51:37.597 | 120 | |
| Window Manager\DWM-1 | 2 | 2019-02-14 04:20:54.773 | 4 |
| Window Manager\DWM-2 | 2 | 2019-02-15 03:57:01.903 | 6 |
Using pd.Grouper to group by time interval#
.groupby(["Account", pd.Grouper(key="TimeGenerated", freq="1D")])
(
    logons_full_df[["TimeGenerated", "EventID", "Account", "LogonType"]]
    .groupby(["Account", pd.Grouper(key="TimeGenerated", freq="1D")])
    .agg({"TimeGenerated": "max", "EventID": "count"})
    .rename(columns={"TimeGenerated": "LastTime", "EventID": "Count"})
)
| LastTime | Count | ||
|---|---|---|---|
| Account | TimeGenerated | ||
| MSTICAlertsWin1\MSTICAdmin | 2019-02-09 | 2019-02-09 23:26:47.700 | 1 |
| 2019-02-11 | 2019-02-11 22:47:53.750 | 4 | |
| 2019-02-12 | 2019-02-12 20:19:44.767 | 7 | |
| 2019-02-13 | 2019-02-13 23:07:23.823 | 2 | |
| 2019-02-14 | 2019-02-14 11:51:37.603 | 1 | |
| 2019-02-15 | 2019-02-15 03:57:02.593 | 3 | |
| MSTICAlertsWin1\ian | 2019-02-12 | 2019-02-12 20:41:17.310 | 3 |
| 2019-02-13 | 2019-02-13 00:57:37.187 | 3 | |
| 2019-02-15 | 2019-02-15 03:56:34.440 | 2 | |
| NT AUTHORITY\IUSR | 2019-02-12 | 2019-02-12 04:40:12.360 | 1 |
| 2019-02-14 | 2019-02-14 04:20:56.110 | 1 | |
| NT AUTHORITY\LOCAL SERVICE | 2019-02-12 | 2019-02-12 04:40:04.573 | 1 |
| 2019-02-14 | 2019-02-14 04:20:54.803 | 1 | |
| NT AUTHORITY\NETWORK SERVICE | 2019-02-12 | 2019-02-12 04:40:04.207 | 1 |
| 2019-02-14 | 2019-02-14 04:20:54.630 | 1 | |
| NT AUTHORITY\SYSTEM | 2019-02-09 | 2019-02-09 12:35:51.683 | 2 |
| 2019-02-10 | 2019-02-10 21:47:21.503 | 11 | |
| 2019-02-11 | 2019-02-11 09:59:02.593 | 2 | |
| 2019-02-12 | 2019-02-12 22:20:59.200 | 53 | |
| 2019-02-13 | 2019-02-13 22:08:46.537 | 10 | |
| 2019-02-14 | 2019-02-14 14:51:37.637 | 33 | |
| 2019-02-15 | 2019-02-15 11:51:37.597 | 11 | |
| Window Manager\DWM-1 | 2019-02-12 | 2019-02-12 04:40:04.483 | 2 |
| 2019-02-14 | 2019-02-14 04:20:54.773 | 2 | |
| Window Manager\DWM-2 | 2019-02-12 | 2019-02-12 22:22:21.240 | 4 |
| 2019-02-15 | 2019-02-15 03:57:01.903 | 2 |
Adding and removing columns#
df[column_name] = expr
new_df = logons_df.copy()

# Adding a static value
new_df["StaticValue"] = "A logon"

# Extracting a substring (there are several ways to do this)
new_df["NTDomain"] = new_df.Account.str.split("\\", 1, expand=True)[0]

# Transforming using an accessor
new_df["DayOfWeek"] = new_df.TimeGenerated.dt.day_name()

# Arithmetic calculations
new_df["BigEventID"] = new_df.EventID * 1000000
new_df["SameTimeTomorrow"] = new_df.TimeGenerated + pd.Timedelta("1D")

print("Old")
display(logons_df[["Account", "TimeGenerated", "EventID"]].head())
print("New")
new_df[[
    "Account", "TimeGenerated", "StaticValue", "NTDomain", "DayOfWeek", "BigEventID", "SameTimeTomorrow"
]].head()
Old
| Account | TimeGenerated | EventID | |
|---|---|---|---|
| 8 | NT AUTHORITY\SYSTEM | 2019-02-12 04:44:10.343 | 4624 |
| 9 | NT AUTHORITY\SYSTEM | 2019-02-12 04:40:11.867 | 4624 |
| 12 | NT AUTHORITY\SYSTEM | 2019-02-12 04:40:03.870 | 4624 |
| 29 | NT AUTHORITY\SYSTEM | 2019-02-12 04:40:11.620 | 4624 |
| 31 | MSTICAlertsWin1\MSTICAdmin | 2019-02-11 22:47:53.750 | 4624 |
New
| Account | TimeGenerated | StaticValue | NTDomain | DayOfWeek | BigEventID | SameTimeTomorrow | |
|---|---|---|---|---|---|---|---|
| 8 | NT AUTHORITY\SYSTEM | 2019-02-12 04:44:10.343 | A logon | NT AUTHORITY | Tuesday | 4624000000 | 2019-02-13 04:44:10.343 |
| 9 | NT AUTHORITY\SYSTEM | 2019-02-12 04:40:11.867 | A logon | NT AUTHORITY | Tuesday | 4624000000 | 2019-02-13 04:40:11.867 |
| 12 | NT AUTHORITY\SYSTEM | 2019-02-12 04:40:03.870 | A logon | NT AUTHORITY | Tuesday | 4624000000 | 2019-02-13 04:40:03.870 |
| 29 | NT AUTHORITY\SYSTEM | 2019-02-12 04:40:11.620 | A logon | NT AUTHORITY | Tuesday | 4624000000 | 2019-02-13 04:40:11.620 |
| 31 | MSTICAlertsWin1\MSTICAdmin | 2019-02-11 22:47:53.750 | A logon | MSTICAlertsWin1 | Monday | 4624000000 | 2019-02-12 22:47:53.750 |
assign function#
Note this introduces a new column to the output - it does not update the dataframe.
df.assign(NewColumn=expr)
(
    new_df[["Account", "TimeGenerated", "DayOfWeek", "SameTimeTomorrow"]]
    .assign(
        SameTimeLastWeek=new_df.TimeGenerated - pd.Timedelta("1W"),
        When=new_df.StaticValue.str.cat(new_df.DayOfWeek, sep=" happened on "),
    )
)
| Account | TimeGenerated | DayOfWeek | SameTimeTomorrow | SameTimeLastWeek | When | |
|---|---|---|---|---|---|---|
| 8 | NT AUTHORITY\SYSTEM | 2019-02-12 04:44:10.343 | Tuesday | 2019-02-13 04:44:10.343 | 2019-02-05 04:44:10.343 | A logon happened on Tuesday |
| 9 | NT AUTHORITY\SYSTEM | 2019-02-12 04:40:11.867 | Tuesday | 2019-02-13 04:40:11.867 | 2019-02-05 04:40:11.867 | A logon happened on Tuesday |
| 12 | NT AUTHORITY\SYSTEM | 2019-02-12 04:40:03.870 | Tuesday | 2019-02-13 04:40:03.870 | 2019-02-05 04:40:03.870 | A logon happened on Tuesday |
| 29 | NT AUTHORITY\SYSTEM | 2019-02-12 04:40:11.620 | Tuesday | 2019-02-13 04:40:11.620 | 2019-02-05 04:40:11.620 | A logon happened on Tuesday |
| 31 | MSTICAlertsWin1\MSTICAdmin | 2019-02-11 22:47:53.750 | Monday | 2019-02-12 22:47:53.750 | 2019-02-04 22:47:53.750 | A logon happened on Monday |
| 36 | MSTICAlertsWin1\MSTICAdmin | 2019-02-11 09:58:48.773 | Monday | 2019-02-12 09:58:48.773 | 2019-02-04 09:58:48.773 | A logon happened on Monday |
| 46 | NT AUTHORITY\SYSTEM | 2019-02-10 05:10:54.300 | Sunday | 2019-02-11 05:10:54.300 | 2019-02-03 05:10:54.300 | A logon happened on Sunday |
| 68 | NT AUTHORITY\SYSTEM | 2019-02-14 04:21:37.637 | Thursday | 2019-02-15 04:21:37.637 | 2019-02-07 04:21:37.637 | A logon happened on Thursday |
| 70 | NT AUTHORITY\SYSTEM | 2019-02-14 04:20:54.370 | Thursday | 2019-02-15 04:20:54.370 | 2019-02-07 04:20:54.370 | A logon happened on Thursday |
| 73 | Window Manager\DWM-1 | 2019-02-14 04:20:54.773 | Thursday | 2019-02-15 04:20:54.773 | 2019-02-07 04:20:54.773 | A logon happened on Thursday |
| 74 | Window Manager\DWM-1 | 2019-02-14 04:20:54.773 | Thursday | 2019-02-15 04:20:54.773 | 2019-02-07 04:20:54.773 | A logon happened on Thursday |
| 93 | NT AUTHORITY\SYSTEM | 2019-02-13 20:11:41.150 | Wednesday | 2019-02-14 20:11:41.150 | 2019-02-06 20:11:41.150 | A logon happened on Wednesday |
| 100 | Window Manager\DWM-2 | 2019-02-12 22:22:21.240 | Tuesday | 2019-02-13 22:22:21.240 | 2019-02-05 22:22:21.240 | A logon happened on Tuesday |
| 110 | NT AUTHORITY\SYSTEM | 2019-02-12 21:20:35.003 | Tuesday | 2019-02-13 21:20:35.003 | 2019-02-05 21:20:35.003 | A logon happened on Tuesday |
| 111 | NT AUTHORITY\SYSTEM | 2019-02-12 21:05:29.523 | Tuesday | 2019-02-13 21:05:29.523 | 2019-02-05 21:05:29.523 | A logon happened on Tuesday |
| 130 | NT AUTHORITY\SYSTEM | 2019-02-12 20:09:16.550 | Tuesday | 2019-02-13 20:09:16.550 | 2019-02-05 20:09:16.550 | A logon happened on Tuesday |
| 135 | NT AUTHORITY\SYSTEM | 2019-02-12 20:30:34.990 | Tuesday | 2019-02-13 20:30:34.990 | 2019-02-05 20:30:34.990 | A logon happened on Tuesday |
| 142 | NT AUTHORITY\SYSTEM | 2019-02-12 20:19:52.520 | Tuesday | 2019-02-13 20:19:52.520 | 2019-02-05 20:19:52.520 | A logon happened on Tuesday |
| 146 | NT AUTHORITY\SYSTEM | 2019-02-15 06:51:51.500 | Friday | 2019-02-16 06:51:51.500 | 2019-02-08 06:51:51.500 | A logon happened on Friday |
| 155 | MSTICAlertsWin1\MSTICAdmin | 2019-02-15 03:56:57.070 | Friday | 2019-02-16 03:56:57.070 | 2019-02-08 03:56:57.070 | A logon happened on Friday |
Drop columns#
df.drop(columns=[column_list])
df.drop(columns=[column_list], inplace=True) # Beware!
(
    new_df[["Account", "TimeGenerated", "StaticValue", "NTDomain", "DayOfWeek"]]
    .head()
    .drop(columns=["NTDomain"])
)
| Account | TimeGenerated | StaticValue | DayOfWeek | |
|---|---|---|---|---|
| 8 | NT AUTHORITY\SYSTEM | 2019-02-12 04:44:10.343 | A logon | Tuesday |
| 9 | NT AUTHORITY\SYSTEM | 2019-02-12 04:40:11.867 | A logon | Tuesday |
| 12 | NT AUTHORITY\SYSTEM | 2019-02-12 04:40:03.870 | A logon | Tuesday |
| 29 | NT AUTHORITY\SYSTEM | 2019-02-12 04:40:11.620 | A logon | Tuesday |
| 31 | MSTICAlertsWin1\MSTICAdmin | 2019-02-11 22:47:53.750 | A logon | Monday |
Some other quick ways of filtering out (in) columns#
.filter(regex="Target.*", axis=1)
logons_df.columns
Index(['Account', 'EventID', 'TimeGenerated', 'Computer', 'SubjectUserName',
       'SubjectDomainName', 'SubjectUserSid', 'TargetUserName',
       'TargetDomainName', 'TargetUserSid', 'TargetLogonId', 'LogonType',
       'IpAddress', 'WorkstationName', 'TimeCreatedUtc'],
      dtype='object')
logons_df.filter(regex="Target.*", axis=1).head()
| TargetUserName | TargetDomainName | TargetUserSid | TargetLogonId | |
|---|---|---|---|---|
| 8 | SYSTEM | NT AUTHORITY | S-1-5-18 | 0x3e7 |
| 9 | SYSTEM | NT AUTHORITY | S-1-5-18 | 0x3e7 |
| 12 | SYSTEM | NT AUTHORITY | S-1-5-18 | 0x3e7 |
| 29 | SYSTEM | NT AUTHORITY | S-1-5-18 | 0x3e7 |
| 31 | MSTICAdmin | MSTICAlertsWin1 | S-1-5-21-996632719-2361334927-4038480536-500 | 0xc54c7b9 |
Filter by Data Type
.select_dtypes(include="datetime")
logons_df.select_dtypes(include="datetime").head() # also "number", "object"
| TimeGenerated | TimeCreatedUtc | |
|---|---|---|
| 8 | 2019-02-12 04:44:10.343 | 2019-02-12 04:44:10.343 |
| 9 | 2019-02-12 04:40:11.867 | 2019-02-12 04:40:11.867 |
| 12 | 2019-02-12 04:40:03.870 | 2019-02-12 04:40:03.870 |
| 29 | 2019-02-12 04:40:11.620 | 2019-02-12 04:40:11.620 |
| 31 | 2019-02-11 22:47:53.750 | 2019-02-11 22:47:53.750 |
Simple Joins#
pd.concat([df_list])
(relational joins tomorrow)
Concatenating DFs#
# Extract two DFs from subset of rows
df1 = logons_full_df[0:10]
df2 = logons_full_df[100:120]

print("Dimensions of DFs (rows, cols)")
print("df1:", df1.shape, "df2:", df2.shape)
display(df1.tail(3))
display(df2.tail(3))
Dimensions of DFs (rows, cols)
df1: (10, 15) df2: (20, 15)
| Account | EventID | TimeGenerated | Computer | SubjectUserName | SubjectDomainName | SubjectUserSid | TargetUserName | TargetDomainName | TargetUserSid | TargetLogonId | LogonType | IpAddress | WorkstationName | TimeCreatedUtc | |
|---|---|---|---|---|---|---|---|---|---|---|---|---|---|---|---|
| 7 | NT AUTHORITY\SYSTEM | 4624 | 2019-02-12 04:43:56.327 | MSTICAlertsWin1 | MSTICAlertsWin1$ | WORKGROUP | S-1-5-18 | SYSTEM | NT AUTHORITY | S-1-5-18 | 0x3e7 | 5 | - | - | 2019-02-12 04:43:56.327 |
| 8 | NT AUTHORITY\SYSTEM | 4624 | 2019-02-12 04:44:10.343 | MSTICAlertsWin1 | MSTICAlertsWin1$ | WORKGROUP | S-1-5-18 | SYSTEM | NT AUTHORITY | S-1-5-18 | 0x3e7 | 5 | - | - | 2019-02-12 04:44:10.343 |
| 9 | NT AUTHORITY\SYSTEM | 4624 | 2019-02-12 04:40:11.867 | MSTICAlertsWin1 | MSTICAlertsWin1$ | WORKGROUP | S-1-5-18 | SYSTEM | NT AUTHORITY | S-1-5-18 | 0x3e7 | 5 | - | - | 2019-02-12 04:40:11.867 |
| Account | EventID | TimeGenerated | Computer | SubjectUserName | SubjectDomainName | SubjectUserSid | TargetUserName | TargetDomainName | TargetUserSid | TargetLogonId | LogonType | IpAddress | WorkstationName | TimeCreatedUtc | |
|---|---|---|---|---|---|---|---|---|---|---|---|---|---|---|---|
| 117 | NT AUTHORITY\SYSTEM | 4624 | 2019-02-12 21:49:11.777 | MSTICAlertsWin1 | MSTICAlertsWin1$ | WORKGROUP | S-1-5-18 | SYSTEM | NT AUTHORITY | S-1-5-18 | 0x3e7 | 5 | - | - | 2019-02-12 21:49:11.777 |
| 118 | NT AUTHORITY\SYSTEM | 4624 | 2019-02-12 21:39:15.897 | MSTICAlertsWin1 | MSTICAlertsWin1$ | WORKGROUP | S-1-5-18 | SYSTEM | NT AUTHORITY | S-1-5-18 | 0x3e7 | 5 | - | - | 2019-02-12 21:39:15.897 |
| 119 | NT AUTHORITY\SYSTEM | 4624 | 2019-02-12 20:11:06.790 | MSTICAlertsWin1 | MSTICAlertsWin1$ | WORKGROUP | S-1-5-18 | SYSTEM | NT AUTHORITY | S-1-5-18 | 0x3e7 | 5 | - | - | 2019-02-12 20:11:06.790 |
Joining rows#
pd.concat([df_1, df_2...])
joined_df = pd.concat([df1, df2])

print(joined_df.shape)
joined_df.tail(3)
(30, 15)
| Account | EventID | TimeGenerated | Computer | SubjectUserName | SubjectDomainName | SubjectUserSid | TargetUserName | TargetDomainName | TargetUserSid | TargetLogonId | LogonType | IpAddress | WorkstationName | TimeCreatedUtc | |
|---|---|---|---|---|---|---|---|---|---|---|---|---|---|---|---|
| 117 | NT AUTHORITY\SYSTEM | 4624 | 2019-02-12 21:49:11.777 | MSTICAlertsWin1 | MSTICAlertsWin1$ | WORKGROUP | S-1-5-18 | SYSTEM | NT AUTHORITY | S-1-5-18 | 0x3e7 | 5 | - | - | 2019-02-12 21:49:11.777 |
| 118 | NT AUTHORITY\SYSTEM | 4624 | 2019-02-12 21:39:15.897 | MSTICAlertsWin1 | MSTICAlertsWin1$ | WORKGROUP | S-1-5-18 | SYSTEM | NT AUTHORITY | S-1-5-18 | 0x3e7 | 5 | - | - | 2019-02-12 21:39:15.897 |
| 119 | NT AUTHORITY\SYSTEM | 4624 | 2019-02-12 20:11:06.790 | MSTICAlertsWin1 | MSTICAlertsWin1$ | WORKGROUP | S-1-5-18 | SYSTEM | NT AUTHORITY | S-1-5-18 | 0x3e7 | 5 | - | - | 2019-02-12 20:11:06.790 |
joined_df.index
Int64Index([  0,   1,   2,   3,   4,   5,   6,   7,   8,   9, 100, 101, 102,
            103, 104, 105, 106, 107, 108, 109, 110, 111, 112, 113, 114, 115,
            116, 117, 118, 119],
           dtype='int64')
ignore_index=True causes Python to regenerate a new index#
pd.concat(df_list, ignore_index=True)
df_list = [df1, df2]
joined_df = pd.concat(df_list, ignore_index=True)

print(joined_df.shape)
joined_df.tail(3)
(30, 15)
| Account | EventID | TimeGenerated | Computer | SubjectUserName | SubjectDomainName | SubjectUserSid | TargetUserName | TargetDomainName | TargetUserSid | TargetLogonId | LogonType | IpAddress | WorkstationName | TimeCreatedUtc | |
|---|---|---|---|---|---|---|---|---|---|---|---|---|---|---|---|
| 27 | NT AUTHORITY\SYSTEM | 4624 | 2019-02-12 21:49:11.777 | MSTICAlertsWin1 | MSTICAlertsWin1$ | WORKGROUP | S-1-5-18 | SYSTEM | NT AUTHORITY | S-1-5-18 | 0x3e7 | 5 | - | - | 2019-02-12 21:49:11.777 |
| 28 | NT AUTHORITY\SYSTEM | 4624 | 2019-02-12 21:39:15.897 | MSTICAlertsWin1 | MSTICAlertsWin1$ | WORKGROUP | S-1-5-18 | SYSTEM | NT AUTHORITY | S-1-5-18 | 0x3e7 | 5 | - | - | 2019-02-12 21:39:15.897 |
| 29 | NT AUTHORITY\SYSTEM | 4624 | 2019-02-12 20:11:06.790 | MSTICAlertsWin1 | MSTICAlertsWin1$ | WORKGROUP | S-1-5-18 | SYSTEM | NT AUTHORITY | S-1-5-18 | 0x3e7 | 5 | - | - | 2019-02-12 20:11:06.790 |
joined_df.index
RangeIndex(start=0, stop=30, step=1)
Joining columns (horizontal)#
pd.concat([df_1, df_2...], axis="columns")
df_col_1 = logons_full_df[0:10].filter(regex="Subject.*")
df_col_2 = logons_full_df[0:12].filter(regex="Target.*")

print(df_col_1.shape, df_col_2.shape)
display(df_col_1.head())
display(df_col_2.head())
(10, 3) (12, 4)
| SubjectUserName | SubjectDomainName | SubjectUserSid | |
|---|---|---|---|
| 0 | MSTICAlertsWin1$ | WORKGROUP | S-1-5-18 |
| 1 | - | - | S-1-0-0 |
| 2 | - | - | S-1-0-0 |
| 3 | - | - | S-1-0-0 |
| 4 | - | - | S-1-0-0 |
| TargetUserName | TargetDomainName | TargetUserSid | TargetLogonId | |
|---|---|---|---|---|
| 0 | SYSTEM | NT AUTHORITY | S-1-5-18 | 0x3e7 |
| 1 | MSTICAdmin | MSTICAlertsWin1 | S-1-5-21-996632719-2361334927-4038480536-500 | 0xc90e957 |
| 2 | MSTICAdmin | MSTICAlertsWin1 | S-1-5-21-996632719-2361334927-4038480536-500 | 0xc90ea44 |
| 3 | MSTICAdmin | MSTICAlertsWin1 | S-1-5-21-996632719-2361334927-4038480536-500 | 0xc912d62 |
| 4 | MSTICAdmin | MSTICAlertsWin1 | S-1-5-21-996632719-2361334927-4038480536-500 | 0xc913737 |
pd.concat([df_col_1, df_col_2], axis="columns")
| SubjectUserName | SubjectDomainName | SubjectUserSid | TargetUserName | TargetDomainName | TargetUserSid | TargetLogonId | |
|---|---|---|---|---|---|---|---|
| 0 | MSTICAlertsWin1$ | WORKGROUP | S-1-5-18 | SYSTEM | NT AUTHORITY | S-1-5-18 | 0x3e7 |
| 1 | - | - | S-1-0-0 | MSTICAdmin | MSTICAlertsWin1 | S-1-5-21-996632719-2361334927-4038480536-500 | 0xc90e957 |
| 2 | - | - | S-1-0-0 | MSTICAdmin | MSTICAlertsWin1 | S-1-5-21-996632719-2361334927-4038480536-500 | 0xc90ea44 |
| 3 | - | - | S-1-0-0 | MSTICAdmin | MSTICAlertsWin1 | S-1-5-21-996632719-2361334927-4038480536-500 | 0xc912d62 |
| 4 | - | - | S-1-0-0 | MSTICAdmin | MSTICAlertsWin1 | S-1-5-21-996632719-2361334927-4038480536-500 | 0xc913737 |
| 5 | MSTICAlertsWin1$ | WORKGROUP | S-1-5-18 | SYSTEM | NT AUTHORITY | S-1-5-18 | 0x3e7 |
| 6 | MSTICAlertsWin1$ | WORKGROUP | S-1-5-18 | SYSTEM | NT AUTHORITY | S-1-5-18 | 0x3e7 |
| 7 | MSTICAlertsWin1$ | WORKGROUP | S-1-5-18 | SYSTEM | NT AUTHORITY | S-1-5-18 | 0x3e7 |
| 8 | MSTICAlertsWin1$ | WORKGROUP | S-1-5-18 | SYSTEM | NT AUTHORITY | S-1-5-18 | 0x3e7 |
| 9 | MSTICAlertsWin1$ | WORKGROUP | S-1-5-18 | SYSTEM | NT AUTHORITY | S-1-5-18 | 0x3e7 |
| 10 | NaN | NaN | NaN | IUSR | NT AUTHORITY | S-1-5-17 | 0x3e3 |
| 11 | NaN | NaN | NaN | SYSTEM | NT AUTHORITY | S-1-5-18 | 0x3e7 |
Statistics 101 with Pandas#
In this part of the workshop we will use a statistical approach to perform data analysis. There are two basic types of statistical analysis: Descriptive and Inferential. During this workshop, we will focus on Descriptive Analysis.
For the purpose of this section, we will use a network compound Security Dataset that you can find here. Therefore, let’s start by importing the dataset.
import pandas as pd
import json

# Opeing the log file
zeek_data = open('../data/combined_zeek.log','r')
# Creating a list of dictionaries
zeek_list = []
for dict in zeek_data:
    zeek_list.append(json.loads(dict))
# Closing the log file
zeek_data.close()
# Creating a dataframe
zeek_df = pd.DataFrame(data = zeek_list)
zeek_df.head()
| @stream | @system | @proc | ts | uid | id_orig_h | id_orig_p | id_resp_h | id_resp_p | proto | ... | is_64bit | uses_aslr | uses_dep | uses_code_integrity | uses_seh | has_import_table | has_export_table | has_cert_table | has_debug_data | section_names | |
|---|---|---|---|---|---|---|---|---|---|---|---|---|---|---|---|---|---|---|---|---|---|
| 0 | conn | bobs.bigwheel.local | zeek | 1.588205e+09 | Cvf4XX17hSAgXDdGEd | 10.0.1.6 | 54243.0 | 10.0.0.4 | 53.0 | udp | ... | NaN | NaN | NaN | NaN | NaN | NaN | NaN | NaN | NaN | NaN |
| 1 | conn | bobs.bigwheel.local | zeek | 1.588205e+09 | CJ21Le4zsTUcyKKi98 | 10.0.1.6 | 56880.0 | 10.0.0.4 | 445.0 | tcp | ... | NaN | NaN | NaN | NaN | NaN | NaN | NaN | NaN | NaN | NaN |
| 2 | conn | bobs.bigwheel.local | zeek | 1.588205e+09 | CnOP7t1eGGHf6LFfuk | 10.0.1.6 | 65108.0 | 10.0.0.4 | 53.0 | udp | ... | NaN | NaN | NaN | NaN | NaN | NaN | NaN | NaN | NaN | NaN |
| 3 | conn | bobs.bigwheel.local | zeek | 1.588205e+09 | CvxbPE3MuO7boUdSc8 | 10.0.1.6 | 138.0 | 10.0.1.255 | 138.0 | udp | ... | NaN | NaN | NaN | NaN | NaN | NaN | NaN | NaN | NaN | NaN |
| 4 | conn | bobs.bigwheel.local | zeek | 1.588205e+09 | CuRbE21APSQo2qd6rk | 10.0.1.6 | 123.0 | 10.0.0.4 | 123.0 | udp | ... | NaN | NaN | NaN | NaN | NaN | NaN | NaN | NaN | NaN | NaN |
5 rows × 148 columns
Data Types#
Before we start reviewing different descriptive analysis techniques, it is important to understand the type of data we are collecting in order to apply these techniques accordingly.
Numerical data#
This type of data represent the output of counting or measuring activities. Numerical data values are usually represented by numbers, and arithmetic calculations such as addition or subtraction do add context to our analysis.
The quantity of network packets transferred over our network is a good example of numerical data generated by counting activities. This type of numerical data is also known as discrete data.
zeek_df[['service','id_orig_h','orig_pkts']].head()
| service | id_orig_h | orig_pkts | |
|---|---|---|---|
| 0 | dns | 10.0.1.6 | 1.0 |
| 1 | gssapi,smb,krb | 10.0.1.6 | 12.0 |
| 2 | dns | 10.0.1.6 | 1.0 |
| 3 | NaN | 10.0.1.6 | 1.0 |
| 4 | NaN | 10.0.1.6 | 1.0 |
The network connection duration is a good example of numerical data generated by measuring activities. This type of numerical data is also known as continuous data.
zeek_df[['service','id_orig_h','duration']].head()
| service | id_orig_h | duration | |
|---|---|---|---|
| 0 | dns | 10.0.1.6 | 0.001528 |
| 1 | gssapi,smb,krb | 10.0.1.6 | 10.761077 |
| 2 | dns | 10.0.1.6 | 0.001599 |
| 3 | NaN | 10.0.1.6 | NaN |
| 4 | NaN | 10.0.1.6 | 0.003069 |
Categorical data#
This type of data represents categories or qualities. Categorical data values are usually described using characters or strings of characters. Moreover, categorical data values can also be represented by numbers. Unlike numerical data, arithmetic operations such as addition or subtraction do not add any extra context.
The network protocol used creating a network connection is a good example of categorical data that describes a category, and does not give us any sense of order (We cannot compare among categories). This type of categorical data is also known as nominal data.
zeek_df[['service','id_orig_h','proto']].head()
| service | id_orig_h | proto | |
|---|---|---|---|
| 0 | dns | 10.0.1.6 | udp |
| 1 | gssapi,smb,krb | 10.0.1.6 | tcp |
| 2 | dns | 10.0.1.6 | udp |
| 3 | NaN | 10.0.1.6 | udp |
| 4 | NaN | 10.0.1.6 | udp |
Another type of categorical data is known as ordinal data. Unlike nominal data, this type of data gives a sense of order (We can compare among categories). A good example of this type of data is the Integrity Level of a process: Low, Medium, High, System. Using the integrity level field as a reference, we can organize our processes from lower to high integrity level (Access Rights).
Descriptive Analysis for Categorical data#
Categorical data types in Pandas#
Pandas uses the category data type to represent both nominal and ordinal data. Let’s check the current type of data for the protocol field we reviewed previously:
zeek_df[['proto','service']].dtypes
proto      object
service    object
dtype: object
As you can see in the previous cell, the current type of data for protocol is string. We can change the type of data to cateogry using the astype method.
zeek_df = zeek_df.astype({'proto': 'category','service': 'category'})
zeek_df[['proto','service']].dtypes
proto      category
service    category
dtype: object
Describe Method#
Using the describe method on categorical data will calculate the following statistics.
zeek_df['service'].describe()
count     521
unique     17
top       ssl
freq      378
Name: service, dtype: object
Frequency of Values#
We can use the groupby, size and sort_values methods to calculate the frequency of network connections by network service.
zeek_df.groupby(['service']).size().sort_values(ascending=False)
service
ssl                           378
dns                            39
krb_tcp                        25
dce_rpc                        20
gssapi                         12
krbtgt/DMEVALS.LOCAL            9
krb,smb,gssapi                  7
krbtgt/dmevals                  6
gssapi,smb,krb                  6
http                            6
cifs/NASHUA                     4
host/nashua.dmevals.local       3
krb,smb,dce_rpc,gssapi          2
gssapi,smb,krb,dce_rpc          1
cifs/NEWYORK                    1
ldap/NEWYORK.dmevals.local      1
HTTP/NASHUA                     1
dtype: int64
Central Tendency#
Central tendency metrics are values that intent to describe a whole group of values. One example of central tendency metric for categorical data is the mode or most frequent value. We can use the mode method to calculate it.
Another central tendency metric that we could use with categorical data is the median, but we can use it only with ordinal data.
zeek_df['service'].mode()
0    ssl
Name: service, dtype: category
Categories (17, object): ['HTTP/NASHUA', 'cifs/NASHUA', 'cifs/NEWYORK', 'dce_rpc', ..., 'krbtgt/DMEVALS.LOCAL', 'krbtgt/dmevals', 'ldap/NEWYORK.dmevals.local', 'ssl']
Correlation#
We can use the crosstab method to create a crossed table with two or more factors.
pd.crosstab(index = zeek_df['service'], columns = zeek_df['proto'])
| proto | tcp | udp |
|---|---|---|
| service | ||
| dce_rpc | 20 | 0 |
| dns | 0 | 39 |
| gssapi | 12 | 0 |
| gssapi,smb,krb | 6 | 0 |
| gssapi,smb,krb,dce_rpc | 1 | 0 |
| http | 6 | 0 |
| krb,smb,dce_rpc,gssapi | 2 | 0 |
| krb,smb,gssapi | 7 | 0 |
| krb_tcp | 25 | 0 |
| ssl | 378 | 0 |
Descriptive Analysis for Numerical data#
Numerical data type in Pandas#
Pandas uses the numeric data type to represent both discrete and continuous data. The numeric data type includes integer and float Python data types.
numerical_data = zeek_df[['duration','orig_bytes','orig_pkts','resp_bytes','resp_pkts']]
numerical_data.dtypes
duration      float64
orig_bytes    float64
orig_pkts     float64
resp_bytes    float64
resp_pkts     float64
dtype: object
We can use the astype method to convert the numeric data type. For example, let’s change the data type for orig_pkts and resp_pkts to integer. We are using the Nullable Integer data type.
numerical_data_updated = numerical_data.astype({'orig_pkts':'Int64','resp_pkts': 'Int64'}, errors = 'ignore')
numerical_data_updated.dtypes
duration      float64
orig_bytes    float64
orig_pkts       Int64
resp_bytes    float64
resp_pkts       Int64
dtype: object
Describe Method#
Using the describe method on numerical data will calculate the following statistics.
numerical_data_updated.describe()
| duration | orig_bytes | orig_pkts | resp_bytes | resp_pkts | |
|---|---|---|---|---|---|
| count | 1025.000000 | 5.770000e+02 | 613.000000 | 5.770000e+02 | 613.000000 |
| mean | 4.569904 | 2.648355e+04 | 20.714519 | 7.068313e+04 | 27.353997 |
| std | 65.376324 | 2.709592e+05 | 255.897916 | 1.344514e+06 | 446.150463 |
| min | 0.000000 | 0.000000e+00 | 1.000000 | 0.000000e+00 | 0.000000 |
| 25% | 0.000000 | 9.970000e+02 | 5.000000 | 1.514000e+03 | 5.000000 |
| 50% | 0.002708 | 9.970000e+02 | 7.000000 | 1.823000e+03 | 6.000000 |
| 75% | 0.010263 | 9.970000e+02 | 7.000000 | 1.823000e+03 | 6.000000 |
| max | 1901.216208 | 4.261160e+06 | 6281.000000 | 3.185056e+07 | 11017.000000 |
Frequency of Values#
Similar to categorical data, we can use the groupby and size methods to calculate the frequency of values. However, sometimes the output might not be the desired, especially when working with continuous data. In this case, we might need to group our values into bins.
We can use the cut method to generate bins with our data.
# Creating a Series with duration data
duration_data = numerical_data_updated['duration']
# Adding duration_bin column
numerical_data_updated['duration_bin'] = pd.cut(duration_data, bins = 500)
# Counting network connections per bin (Top 15)
numerical_data_updated.groupby(['duration_bin']).size()[:15]
duration_bin
(-1.901, 3.802]     975
(3.802, 7.605]        3
(7.605, 11.407]      16
(11.407, 15.21]       9
(15.21, 19.012]       0
(19.012, 22.815]      2
(22.815, 26.617]      0
(26.617, 30.419]      0
(30.419, 34.222]      1
(34.222, 38.024]      2
(38.024, 41.827]      0
(41.827, 45.629]      4
(45.629, 49.432]      0
(49.432, 53.234]      0
(53.234, 57.036]      4
dtype: int64
We can use the hist method to visualize the distribution of frequencies.
# Filtering duration values less or equal to 0.02
numerical_data_updated[numerical_data_updated['duration'] <= 0.02].hist(column = 'duration')
array([[<AxesSubplot:title={'center':'duration'}>]], dtype=object)
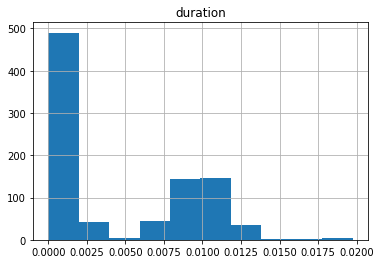
Central Tendency#
Central tendency metrics are values that intent to describe a whole group of values.
One example of central tendency metric for numerical data is the mode or most frequent value. We can use the mode method to calculate it.
zeek_df['duration'].mode()
0    0.0
dtype: float64
Another central tendency metric that we could use with numerical data is the mean or average value. We can use the mean method to calculate it.
zeek_df['duration'].mean()
4.569903998491241
The mean or average is a good central tendency metric when the distribution of our data is not shifted to one side (Right or Left) or not skewed. If the distribution of our data is skewed, there might be extreme values (Short or Large) in our data that affect the value of our mean. A central tendency metric that is not affected by extreme values is the median. We can use the median method to calculate it.
zeek_df['duration'].median()
0.002707958221435547
Shape of Distribution of Frequencies#
In the previous section we mentioned that our data might contain extreme values (Short or Large) that affect the calculation of the mean or average of numerical data. These extreme values could also impact the shape of the distribution of frequencies of our data.
One metric that can help us to describe the shape of the distribution of frequencies is Kurtosis. This metric identifies whether the tails of a given distribution contains extreme values. A Kurtosis value greater than 3 might indicate the presence of large outliers. On the other hand, a Kurtosis value less than 3 might indicate the presence of small outliers.
We can use the kurtosis method to calculate it.
zeek_df['duration'].kurtosis()
706.6612212729053
Another metric that can help us to describe the shape of the distribution of frequencies of our data is Skewness. This metric identifies if the shape of our distribution of frequencies deviates from the symmetrical bell curve, or normal distribution. In other words, it identifies if the distribution of frequencies is shifted to the right or to the left.
A negative value for skewness indicates that our distribution of frequencies is left skewed (left tail). On the other hand, a positive value for skewness indicates that our distribution of frequencies is right skewed (right tail).
We can use the skew method to calculate it.
zeek_df['duration'].skew()
25.313750482239236
Variability#
After calculating central tendency and shape metrics, we identified the presence of potential extreme values. These extreme values are different from most of our data values. This means that there exists variability among our data values.
Let’s start by visually describing the variability of our data using a box plot. We can use the boxplot method to graph one.
# Filtering duration values less or equal to 0.02
numerical_data_updated[numerical_data_updated['duration'] <= 0.02].boxplot(column = 'duration', vert = False, grid = False)
print(numerical_data_updated['duration'].describe())
count    1025.000000
mean        4.569904
std        65.376324
min         0.000000
25%         0.000000
50%         0.002708
75%         0.010263
max      1901.216208
Name: duration, dtype: float64
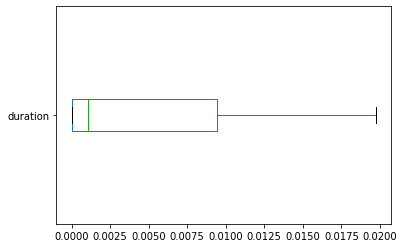
A very basic metric that we can use to describe the variability in our data is the Range of values, which is the difference between the maximum and minimum value. We can use the min and max methods to calculate the range.
range = zeek_df['duration'].max() - zeek_df['duration'].min()
range
1901.2162079811096
Another metric that we can use is the Interquartile Range (IQR) of values, which measures the variability or spread of the middle half of our data. We calculate it by subtracting the first quartile (25%) from the third quartile (75%). We can use the quantile method to calculate the first and third quartile of our data.
iqr = zeek_df['duration'].quantile(q = 0.75) - zeek_df['duration'].quantile(q = 0.25)
iqr
0.01026296615600586
The last variability metric that we would like to share with you is Standard Deviation. This value gives us an idea of, on average, how far are our values from the mean. We can use the std method to calculate the standard deviation of our data.
std_dev = zeek_df['duration'].std()
std_dev
65.37632416317761
Correlation#
To graphically understand the relationship between 2 numerical variables, we can use a scatter plot. we can use the plot.scatter method to create a scatter plot.
# Filtering orig_bytes < 10000
zeek_df[zeek_df['orig_bytes'] < 10000].plot.scatter(x = 'orig_bytes', y = 'resp_bytes')
<AxesSubplot:xlabel='orig_bytes', ylabel='resp_bytes'>
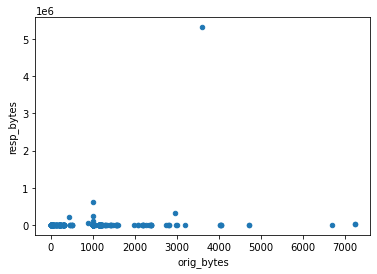
Pandas also provies us with the corr method to calculate correlation coeficients (Default method: Pearson coefficient - Linear Relation). We can correlate 2 or more numerical variables.
numerical_data_updated.corr()
| duration | orig_bytes | orig_pkts | resp_bytes | resp_pkts | |
|---|---|---|---|---|---|
| duration | 1.000000 | 0.088359 | 0.935223 | 0.903869 | 0.930104 |
| orig_bytes | 0.088359 | 1.000000 | 0.148155 | 0.075493 | 0.099968 |
| orig_pkts | 0.935223 | 0.148155 | 1.000000 | 0.980667 | 0.997377 |
| resp_bytes | 0.903869 | 0.075493 | 0.980667 | 1.000000 | 0.988010 |
| resp_pkts | 0.930104 | 0.099968 | 0.997377 | 0.988010 | 1.000000 |
End of Session#
Break: 5 Minutes#